
Iron Ore Is On A Hot Roll
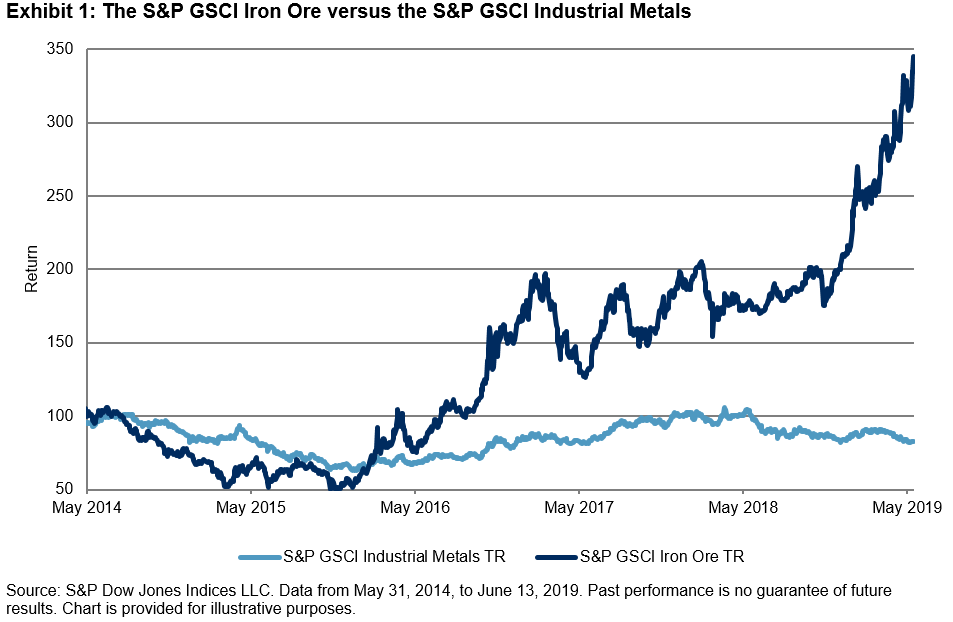
The S&P GSCI Iron Ore has been on a tear this year, up 72.47% YTD as of June 13, 2019, breaking through the previous high from May 22, 2019. It had by far the best YTD performance out of any of the commodities indices in the S&P GSCI Series. This bullish performance during the first half of 2019 is a good example of how using commodities in a tactical way can boost returns for investors. The S&P GSCI Iron Ore was able to distance itself from other metals. For example, the S&P GSCI Industrial Metals was flat over the same period.
(Click on image to enlarge)
Prior to the recent rally, the S&P GSCI Iron Ore was relatively range bound for two years due to competing for macro themes. There are several factors to point to when explaining the recent YTD performance. First, the challenging risk-off environment in Q4 2018 leftmost assets finishing the year in the red. This allowed for neutral-to-bearish investor positioning entering 2019, especially for those commodities with a high beta to global markets and specifically to Chinese economic activity.
Second, to ease the burden of U.S. tariffs and to support the slowing economy, Beijing announced a variety of stimulus measures focused on boosting its industrial complex. China currently purchases approximately two-thirds of seaborne iron ore. As has been seen in the last few years with each China hard landing or global growth scare, the People’s Bank of China has not hesitated to turn on its most-adored stimulus levers. Those levers have historically been ways to increase funding for construction and infrastructure projects. While the planned move away from manufacturing to a more consumer-based economy continues to creep along in China, it will likely take a long time to implement this plan, and the Chinese administration appreciates that the current most effective way to support economic growth remains via these industrial support levers. The S&P GSCI Iron Ore is highly correlated to Chinese economic indicators such as real estate investment, industrial production, and steel production. Several of these indicators spiked in Q1 2019 just as iron ore prices started to rise (see Exhibit 2). It is worth noting that the most recent industrial production number dropped to a five-year low of 5%.
(Click on image to enlarge)

Third and most important, supply has been drastically curtailed in recent months. Inventories held globally have been reduced and are on pace to fall to five-year lows within the next few months. The Vale dam collapse in Brazil in late January 2019 and a cyclone in Australia in March 2019 reduced supply from the world’s two largest iron ore exporters. Shipments from Australia have largely returned to normal, but it is likely that Brazilian iron ore exports will be constrained for an extended period of time. Imported iron ore stock at Chinese ports fell to a 2.5 year low of 121.6mm metric tons in mid-June 2019 according to Steelhome.
(Click on image to enlarge)

The iron ore market has a number of characteristics that make it distinctive as an investable asset, but these characteristics are relatively common among commodities; iron ore supply is concentrated in a handful of geographic regions and controlled by a small number of players, and demand is dictated by one major end-user (China). Both supply and demand are subject to shocks caused by geopolitical events, unforeseen natural disasters, and policy decisions, as well as the actions of individual asset owners. However, with unique characteristics can come unique tactical investment opportunities for investors.
Copyright © 2018 S&P Dow Jones Indices LLC, a division of S&P Global. All rights reserved. This material is reproduced with the prior written consent of S&P DJI. For more information ...
more

