
How Much Longer Can The Bull Market Go On?
Since November 10 the stock market has become an amazing machine relentlessly advancing ever upward.In the past sixty eight NYSE trading sessions; the Dow Jones has closed at a new all-time high in twenty six of them. That’s 38% of the trading days of the past four months that saw the Dow Jones close at a record high.Wow!
How much longer can that go on? Most likely long enough to make us bears look foolish for refusing to believe the current advance isn’t a permanent feature in the stock market. But it isn’t. Look at the Dow Jones BEV chart below. Within the circle, since early November, it’s as if market declines have been outlawed, and we know that isn’t going to continue forever. The next time the Dow’s BEV plot breaks below its -2.5% line (see table in chart), I expect the current good times for the stock market bulls will be over.

Trading volume for the thirty blue-chip stocks comprising the Dow Jones (Red Plot below) remains very healthy. What’s so odd about this is that beginning last November, for the first time since January 2000, rising Dow Jones volume is seen with an advance in the Dow Jones itself.
The chart below only goes back to 2010, but until last November, all market advances only occurred as trading volume declined, and trading volume only increased during market declines. This was an inversion in the law of supply and demand that began in January 2000 as the NASDAQ High-Tech bubble began deflating seventeen years ago. So what changed in November? I haven’t a clue, but something did.
The day is coming when the current advance in the Dow Jones will only be a pleasant memory. When that happens, I’m wondering will trading volume contract as it should during market declines, or will it once again explode upwards as the Dow Jones deflates.
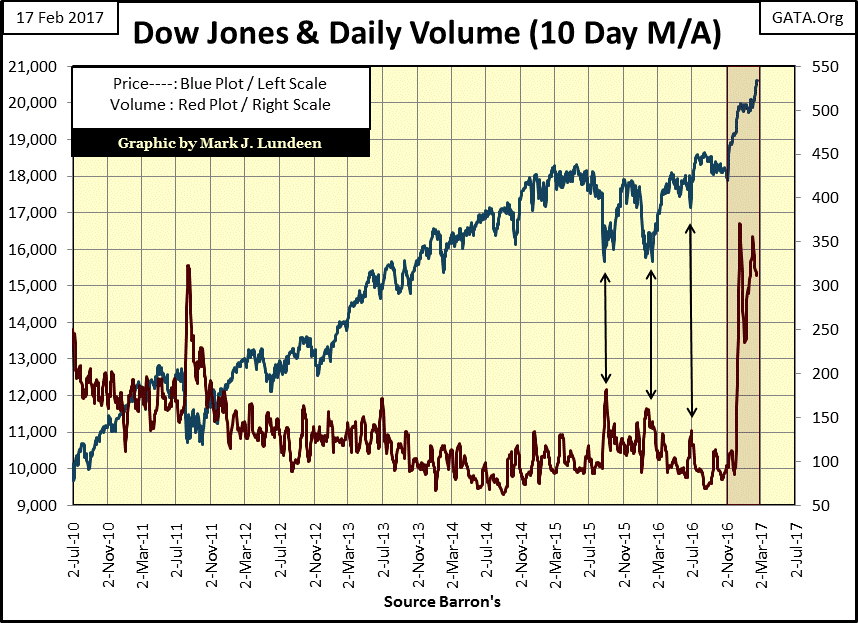
This is an important point to be aware of; because if trading volume doesn’t expand on the next stock market decline, it’s telling us the “policy makers” have decided to allow the stock market to deflate. When that happens, as one day it must, I expect that the world will be shocked at how far the stock market will decline. I expect this will also prove to be true for the bond market too, as bond yields follow dividend yields upwards.
Ultimately, the financial markets will experience a selling panic that will make history, with the precious metals markets to be one of the prime beneficiaries of the flow of flight capital fleeing deflation in the stock and bond markets. But until then, we long suffering bulls in the gold and silver markets will just have to be patient.
Last week I wrote about a bull box forming in the Dow Jones, and this week I’m closing the box. I have to; the past seven NYSE trading sessions saw the Dow Jones close at new all-time highs, and those seven advancing days closed the box. And as expected, with the closing of the box the Dow Jones itself was up nicely; 570 points, or 2.84% since Wednesday February 8. In the short term, I expect the stock market will continue advancing.

So much for the Dow Jones.How are the other major market indexes doing at the end of the week? Of the twenty three I follow, the top twenty of them ended the week either at a new all-time high, or within 1% of being one.
.

Moving on to the Dow Jones Total Market Groups (DJTMG); the end of the week found 17 of the 74 groups I follow making new all-time highs; an increase of seven from last week. After seeing the Dow Jones and the major market indexes advancing since early November, are we going to see new all-time highs in the DJTMG increasing into the 20ies in the weeks to come?

Maybe, as of the end of the week there are 15 additional groups within 5% of making new all-time highs (-0.001% column in table below); all within scoring position of seeing new all-time highs. But unless we see the DJTMG’s top 20 increase from where it’s been in the past few years (below), I don’t think that’s likely.
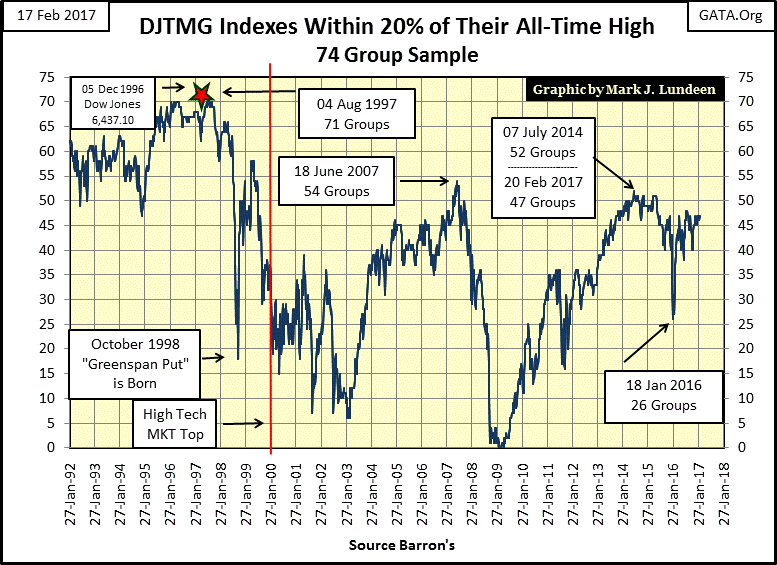
What’s happening in the top 20 is that the same 47 groups that have resided in the light brown columns in the table below have been migrating towards the BEV Zero column (new all-time highs), but the groups in the -20% and lower columns, are for the most part content staying where they are. That’s pretty much true going down to the -95% column, which I don’t show as including all of the columns down to -95% makes for a bad graphic.
The best time to enter the stock market is when the top 20 plot above is rising from a low level; a situation found at the end of a bear market. This is when the market advance in the stock market is broad based, which is typical of the early stages of all bull markets.
Currently, the stock market is behaving like an aging bull market, where one has to be selective in which stock groups one hazards money in. That the Dow Jones is making new all-time highs for 38% of its daily closings since November 10, yet the DJTMG’s top 20 has for two years failed to break above 50 in the chart above, and table below (20% From All-Time High column) during this same time period, is a strong indication that the market advance that began in March 2009 is much closer to the end than its beginning.

Moving on to gold and its step sum below, its apparent the market advance that began last December is still intact, and hopefully will continue for the next year.
.
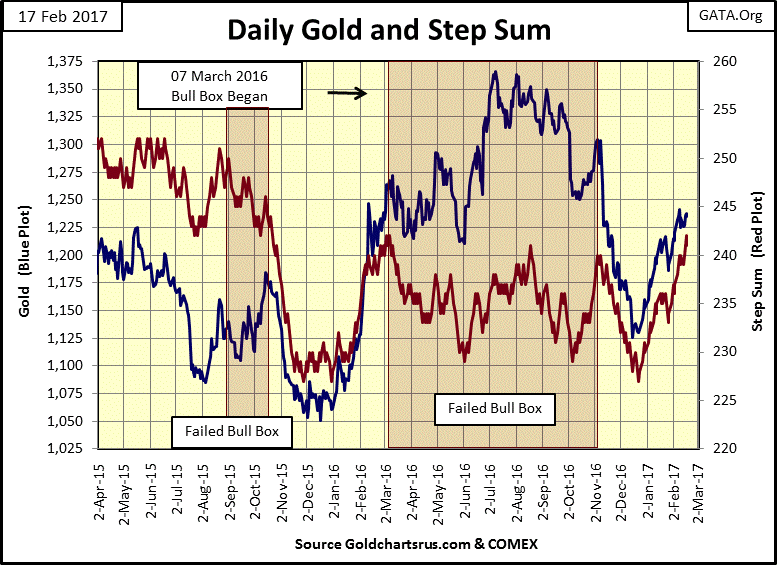
But examining gold’s step sum table below, there are problems I can see. On February 7, gold closed at $1,234 with its 15 count at 3. On today’s close, gold ended the week at the same $1,234 with its 15 count at 7, and it was at 9 the day before. That’s a lot of daily advances with zero effect on the price of gold. Will this ultimately prove to be a case of what refuses to go up will eventually go down?
My concerns for the gold market are that when once again down day overwhelms advancing days, and the day is coming when that will happen, we could have a big market decline from here. I don’t expect the price of gold to fall below the lows of last December, but I can’t guarantee that.
Here’s the big problem I see gold and silver have; there’s no one in a position of power in Washington or on Wall Street, or anywhere in the world that wants the old monetary metals rising in price as they inflate their currencies to worthlessness while they pump up valuations in their stock and bond markets. I really believe that until the financial markets come under some distress selling, the precious metals aren’t going to do much to make people like me happy.
Look at the Dow Jones’ 15 count below. For the past five weeks we see nothing but negative values as declining days dominate the market. Yet in the past 25 trading days we see nine new all-time highs as the Dow Jones advanced almost a 1,000 points. Unlike gold and silver, in early 2017 the Dow Jones wants to go up.
But should you buy something just because it’s going up? That proved to be a disastrous market strategy during the late stages of the high-tech and mortgage bubbles.
It seems to me that money is made by buying into weakness, which then is sold into strength at a later date. Obviously the play for this market is to sell the stock market, if you have any, and move the proceeds into precious metal assets – and then wait.

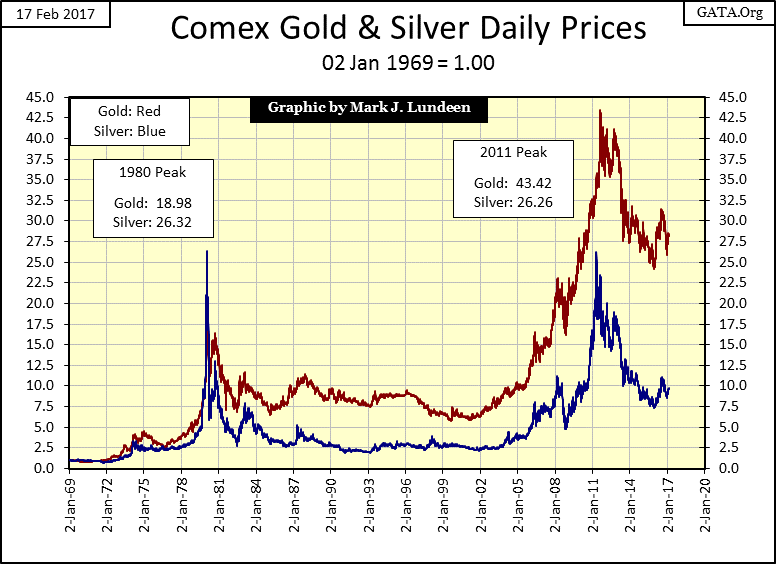
This is a good time to take a historical view of the gold and silver markets. Gold and silver’s indexed performance (02 Jan 1969 = 1.00) is plotted below. On 02 Jan 1969 gold closed at $43.50, and $1.85 for silver. It’s been a wild half century for the old monetary metals. And with Washington and Wall Street still in control of “monetary policy” for the foreseeable future, the best is yet to come.
At their bull market peak in January 1980; gold increased by a factor of 18.98 and silver by 26.32 from their lows of eleven years earlier. The following two decades saw the old monetary metals languish as the bulls, for good reason, moved their money over to the stock market.
But in the aftermath of the NASDAQ High-Tech bubble, prices for gold and silver once again began to rise as the “policy makers” began inflating a bubble in the real estate market. And I don’t think that was merely a coincidence.
The market for gold and silver are like barnacles on the side of a whale when compared to the stock and debt markets. It doesn’t take much in the way of flow of funds from the financial markets into the old monetary metals to result in significant price appreciation in the metals. In 2002, anticipating the predictable deflation in the mortgage market, the benefit of holding a core position in gold and silver bullion was only logical, and the smart money made the move.
So far in gold and silver’s current bull market, gold (Red Plot above) has outperformed. But that should change as the bull market matures. In the Silver to Gold Ratio (SGR) chart below, it’s a rule of thumb that the SGR rises in precious metal bear markets, and declines during bull markets. Seeing the current SGR at 68.53 tells us that the bull market in gold and silver have a long way to go before it’s over.
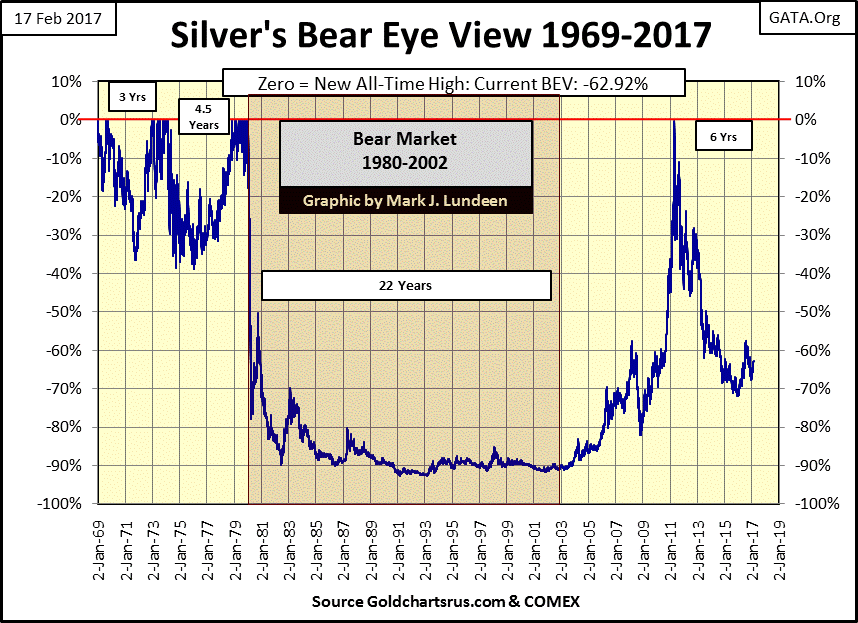
Here’s the most amazing Bear’s Eye View (BEV) chart in my data base. Silver’s last all-time high dates back to January 1980: thirty-seven years ago. Though in April 2011, it came within * ELEVEN CENTS * of breaking its 1980s highs – but failed to.
Other than an ounce of silver, or digital computing power, what else is cheaper today than it was in January 1980? A tube of toothpaste? A gallon of gas?An acre of mosquito infested swamp land in Florida? And the commercial and industrial uses for silver over the past decades have exploded, as its above ground inventories have been reduced from multi-billion to a few hundred million ounces. Silver today actually is rarer than gold.
So why in 2017 can we buy an ounce of silver for less than $20? It’s a “policy” thing, and today “policy” is a denial of supply and demand reality.

Back to silver’s BEV chart.After January 1980, silver saw one of the great bear markets of the 20th century. From 1990 to 2003 it just collapsed on its BEV -90% and did nothing for thirteen years. During the mortgage bubble (2002-08), silver broke above its BEV -60% line, before collapsing down to its BEV -80% line. But what happened next is amazing. From November 2008 to April 2011, silver increased from below is -80% line to just a hair below making a new all-time high at the BEV 0.00% line.
But note that most of that advance occurred in a single year; from May 2010 to April 2011, silver leaped up from its BEV -60% line ($17.49) up to its BEV 0.00% line ($48.58). That was a one year advance of 177%, and it would have been much more in the months to follow had the “policy makers” not decided to put an end to this embarrassing market development during the post-credit crisis market. Silver is a caged animal. When Mr Bear pushes aside the “policy makers” – watch silver roar.
For those who followed me into Eskay Mining (ESK.T Venture), Eskay’s CEO Mac Balkam issued a press release on Monday February 13th with very good news.
http://eskaymining.com/full_news.asp?nid=118&biraj=News%20Release
Its joint venture partner is Silver Standard Resources (Nasdaq:SSRI).Silver Standard is a solid precious metal mining company with considerable experience in British Columbia’s Golden Triangle, a company with the financial wherewithal to finish any project it starts.
As per the option agreement; SSRI will infuse capital into Eskay with a $300,000 private placement (at $0.20 a share), making Silver Standard a shareholder in Eskay Mining. For SSRI to earn a 51% undivided interest in the optioned property, it’s committed to spend $11.7 million dollars over the next three years in drilling, with $3.7 million spent the first year, and $4.0 million in each of the following two years.
Keep in mind this agreement between Eskay and Silver Standard is an option that obligates Silver Standard to certain actions and expenditures for drilling as long as certain conditions are met. The specifics are in the press release. But one can’t invest in mineral exploration unless one is an optimist.
Seeing a highly respected mining company decide to spend millions of dollars of its own money on Eskay’s property high in the Canadian Rockies is vindication for my high opinion of this little exploration play. Whether or not Silver Standard finds anything is to be determined by the results of their $11.7 million dollar drilling program, so at this point in time no guarantees can be given.
This link gives information on the Golden Triangle my readers may benefit from. There are no guarantees in this life. That’s for sure. But when one considers the potential of the Golden Triangle for the discovery of enormous bodies of precious and base metal ore, the risk-reward ratio seems to justify staking 2% to 5% of one’s allocation for mining stocks in the exploration of this area. If someone decides to do so, one simply couldn’t find a better exploration company to invest in than Eskay Mining.


thanks for sharing