
How Are Hedge Funds Positioned At Week's End?
Following futures positions of non-commercials are as of February 18, 2020.
10-year note: (IEF) Currently net short 306.3k, down 92.7k.
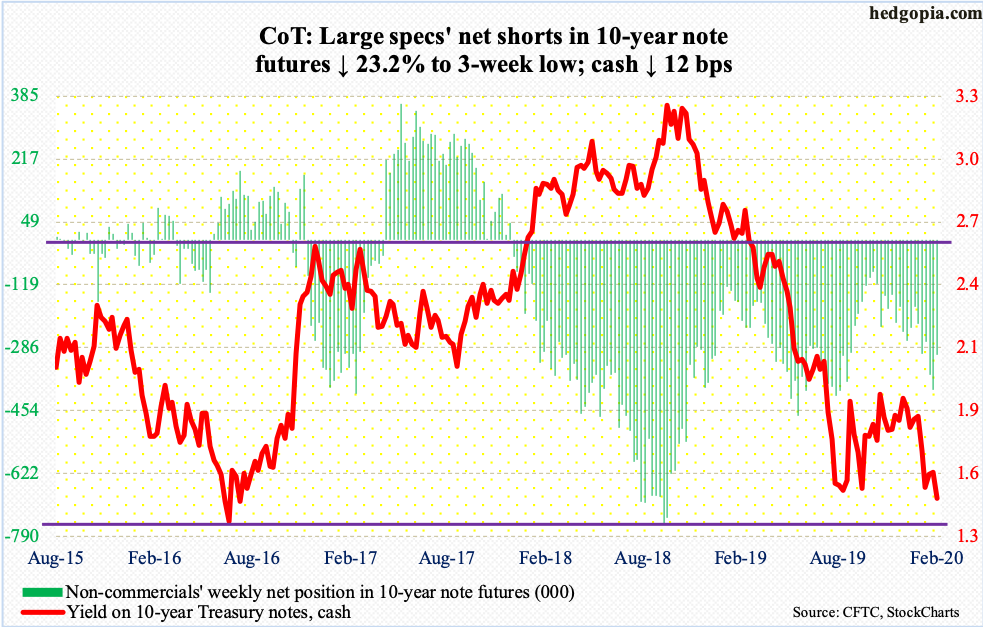
Once again, bond bears (on price) were having to defend 1.51 percent on the 10-year Treasury yield (1.47 percent). Most recently, this level was hit last October as well as this January and February.Friday, it gave way, with the intraday low of 1.44 percent just about testing the September 2019 low of 1.43 percent.In the vicinity lies major support. The 10-year printed 1.39 percent in July 2012 and 1.34 percent four years after that. Since the July 2016 low, rates rose to 3.25 percent in October 2018, before coming under renewed pressure. Throughout this, the economy chugged along, yet the bond market refuses to signal an ‘all clear’ sign, which significantly raises the odds that new lows are just a matter of when not if.
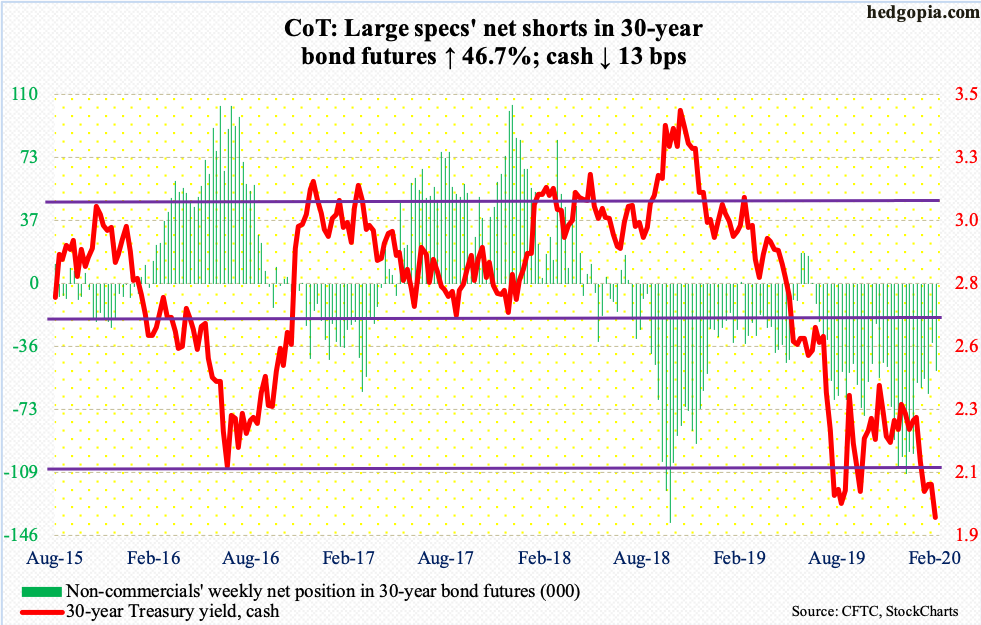
30-year bond: Currently net short 50.3k, up 16k.
Major economic releases next week are as follows.
The S&P Case-Shiller home price index (December) is due out Tuesday. Nationally, US home prices increased 3.5 percent year-over-year in November. This is much slower than the 6.5 percent pace clocked in March 2018 but faster than last August’s 3.1 percent.
New home sales (January) will be published Wednesday.December sales dropped 0.4 percent month-over-month to a seasonally adjusted annual rate of 694,000 units.Last June’s 729,000 was the highest since July 2007.
Durable goods orders (January), GDP (4Q19, 2nd print) and corporate profits (4Q19, preliminary) are scheduled for Thursday.
In December, orders for non-defense capital goods ex-aircraft – proxy for business capex plans – rose one percent y/y to $68.6 billion (SAAR).This was the second y/y increase in a row after four straight declines.
The advance estimate showed real GDP grew 2.1 percent in 4Q19, similar to 3Q19’s.
In 3Q19, corporate profits with inventory valuation and capital consumption adjustments fell 0.8 percent y/y to $2.09 trillion (SAAR).The all-time high of $2.19 trillion was hit five years before that.
Friday brings personal income/spending (January) and the University of Michigan’s consumer sentiment index (February, final).
In the 12 months to December, core PCE – the Fed’s favorite measure of consumer inflation – rose 1.58 percent. This was the 15th consecutive month of sub-two percent reading.The Fed has a two percent goal.
February’s preliminary estimate showed consumer sentiment rose 1.1 points m/m to 100.9. This was the fifth reading of 100 or higher since October 2017.
WTI crude oil: (OIL) Currently net long 604.6k, down 6.9k.
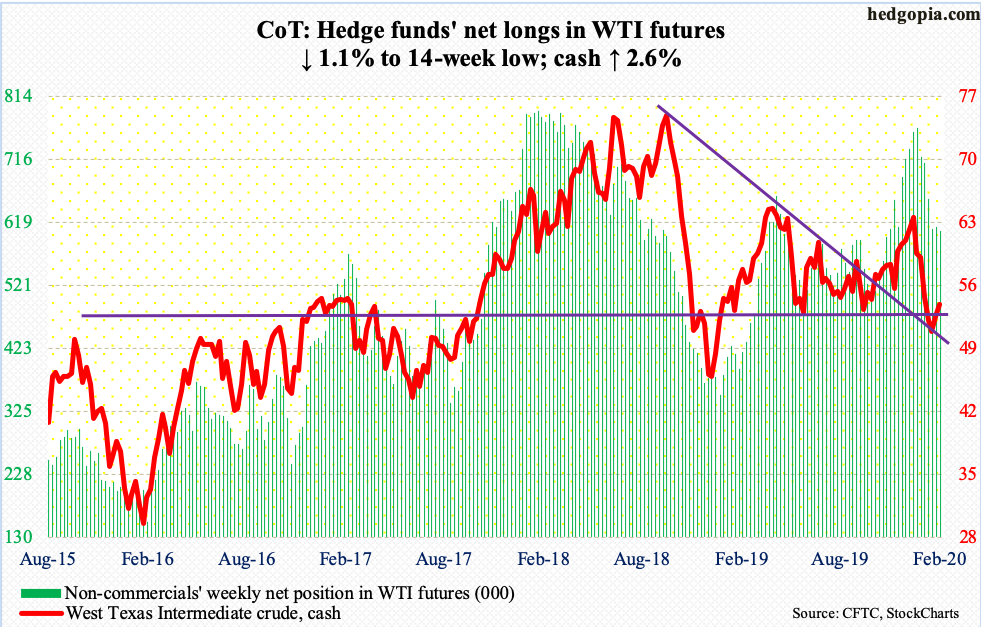
The cash ($53.38/barrel) rallied 2.6 percent this week – second straight positive week.This followed five weeks of decline. The EIA report for the week of January 14 likely contributed to bullish sentiment.
US crude imports fell 431,000 barrels/day to 6.5 million b/d.Stocks of gasoline and distillate dropped as well – down two million barrels and 635,000 barrels respectively to 259.1 million barrels and 140.6 million barrels .Refinery utilization rose 1.4 percentage points to 89.4 percent. Crude production remained unchanged at record 13 mb/d. Crude inventory, however, rose 415,000 barrels to 442.9 million barrels.
After reclaiming the 10-day last week, WTI this week recaptured the 20-day as well. The daily is beginning to get extended but has room to rally on the weekly. It will help if bulls manage to push through $55.Thursday, it did rally to $54.66 intraday, but bulls were unable to hang on to it. Support at $50-51 could be tested again.
E-mini S&P 500: Currently net long 29.8k, down 5k.
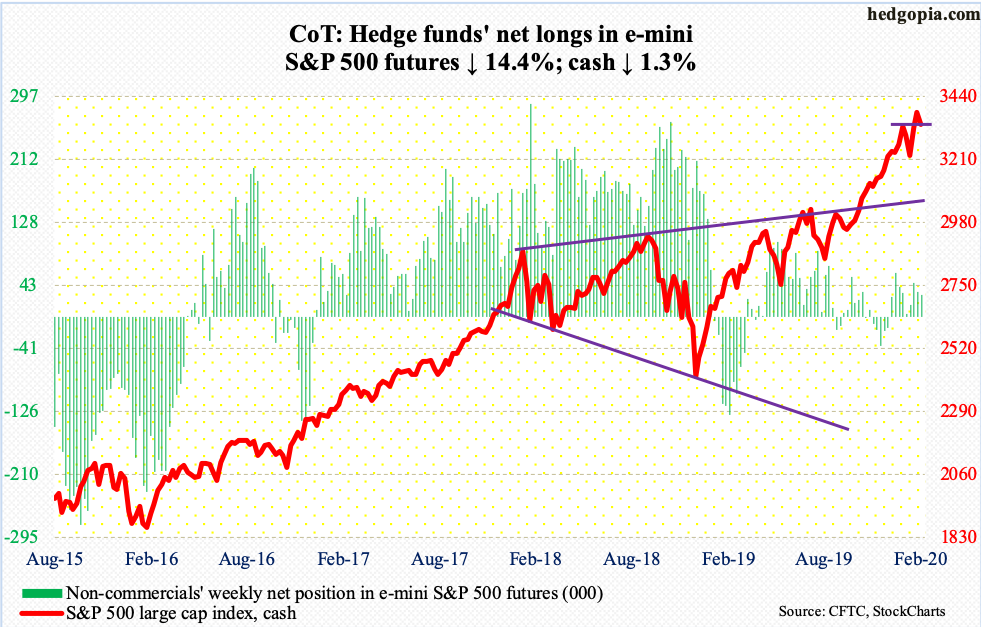
Bulls were on the defensive this week.Wednesday, they rallied the cash (3337.75) to a new intraday high of 3393.52, but in the next very session were forced to test two-week-old breakout at 3330s. Friday, it was tested again, with the S&P 500 essentially closing on that level. This likely gives way in the sessions ahead. The 50-day, which late January was successfully tested at 3215, now lies at 3274. The last time this average was breached was early October last year.
At least until Wednesday, flows were not cooperative.In the week ended that session, SPY (SPDR S&P 500 ETF), VOO (Vanguard S&P 500 ETF) and IVV (iShares Core S&P 500 ETF) together lost $3.5 billion (courtesy of ETF.com). In the same week, $2 billion came out of US-based equity funds (courtesy of Lipper); this followed inflows of $8.2 billion in the prior two weeks.
In the meantime, money-market funds increased $8.3 billion week-over-week to $3.63 trillion (courtesy of ICI). From the first week of January when they hit $3.64 trillion, which was the highest total since July 2009, these funds came under slight pressure, but only to bottom at $3.62 trillion two weeks ago. Bulls were hoping they would continue to drop and that some of this would flow into equities (more on this here). This is not happening.
Foreigners, however, are increasingly turning into a tailwind (more on this here).
Euro: (FXE) Currently net short 91.5k, up 5.8k.
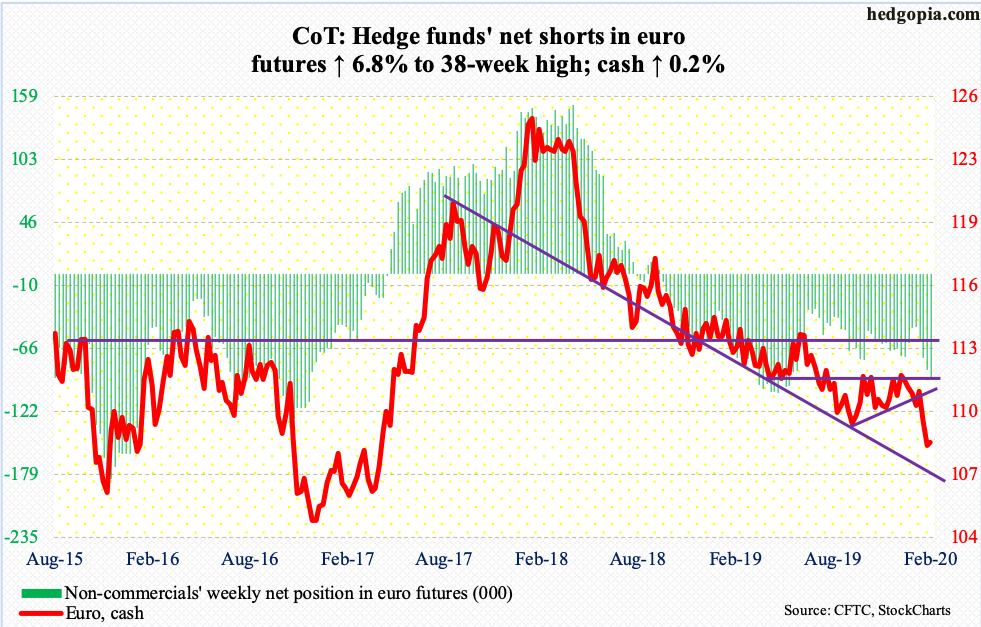
Euro bulls are trying to put their foot down. In merely 14 sessions, the cash ($108.42) went from $111 to $107.82, which was the intraday low both Thursday and Friday. In the process, it lost decent support just under $110 and then the October 1st low of $108.85.
The daily is grossly oversold.Shorter-term averages are still dropping. Sideways action will help.
In a worse-case scenario, the euro in due course goes on to test $104-105, which is where it bottomed between March 2015 and January 2017.
Gold: (GLD) Currently net long 353.6k, up 45.7k.
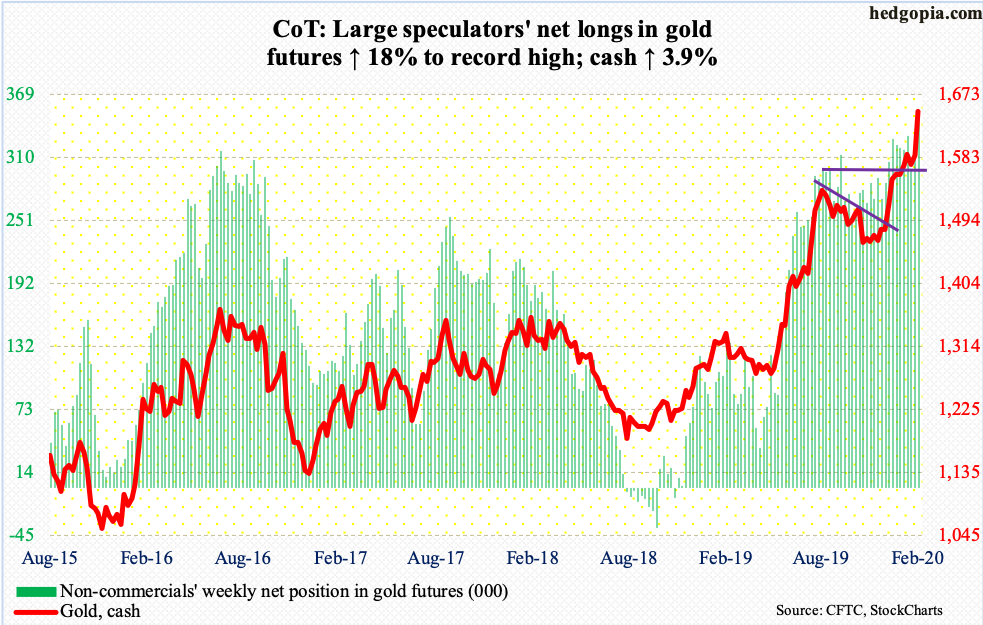
In the week to Wednesday, both IAU (iShares Gold Trust) and GLD (SPDR Gold ETF) saw healthy flows, with the former gaining $151 million and the latter $476 million (courtesy of ETF.com).In the prior four, GLD took in $2.2 billion.
The cash ($1,648.80/ounce) broke out to a seven-year high, rallying past the January 8th intraday high of $1,613.30. Back then, gold retreated quickly after making that high but gold bugs repeatedly defended breakout retest at $1,550s-60s, a crucial price point going back to April 2011.
This week’s action potentially is an important development. In September 2011, the yellow metal peaked at $1,923.70, before proceeding to bottom at $1,045.40 in December 2015. Since that low, gold has printed higher lows and higher highs, not to mention the latest constructive action.
Nasdaq 100 index (mini): (COMP) Currently net long 18.4k, up 9.7k.
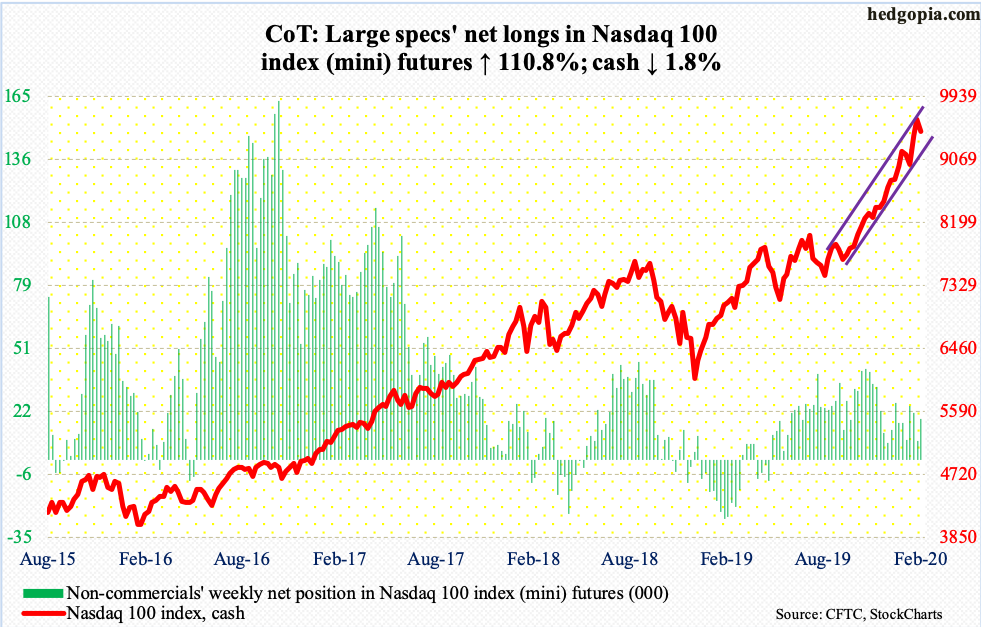
QQQ (Invesco QQQ Trust) pulled in another $727 million in the week to Wednesday (courtesy of ETF.com). This comes in the wake of inflows of $2.8 billion in the prior three. The cash (9446.69) is already up 5.1 percent this month.Should it hold, it will have rallied for six months in a row.The average investor sees this and gets pulled in.
Needless to say, technicals are overbought, and the relentless upward momentum took a small hit this week. Thursday, the daily RSI dropped back below 70.Friday, the 10-day was lost. For now, risks remain to the downside.Nearest support lies at 9300.
Russell 2000 mini-index: (IWM) Currently net long 40.9k, up 971.
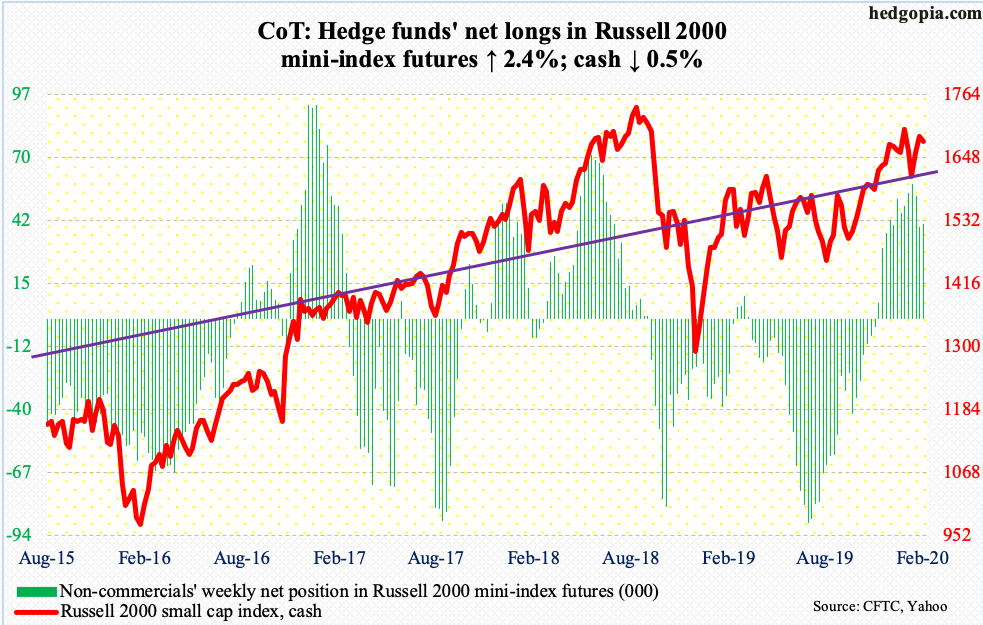
In the week to Wednesday, IWM (iShares Russell 2000 ETF) attracted $176 million, while IJR (iShares Core S&P Small-Cap ETF) lost $4 million (courtesy of ETF.com).
Bulls and bears are fighting for control of 1680s, which has proven to be an important level for nearly two months now. For now, odds are shifting the latter’s way. The past several sessions, the cash (1678.61) faced trouble at 1700, a takeout of which would have cleared the way for a test of 1715.08, which was tagged on January 17 and which also approximates the underside of a broken trend line from last October.
US Dollar Index: Currently net long 24.2k, up 4.7k.
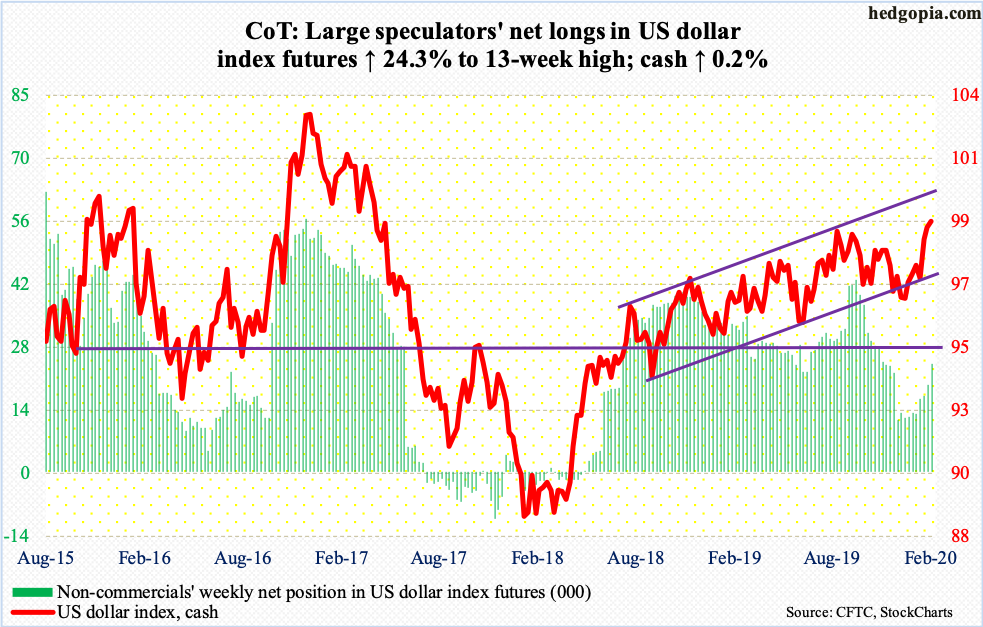
In a true ‘momentum begets momentum’ fashion, the cash (99.19) rallied all along the daily sharply rising upper Bollinger band this week – until a massive red candle showed up Friday.
Until Thursday, the US dollar index had broken through 99.30s, which was tagged twice last September and October. By the time the week was out, the index was pushed under that price point.It is still above 99, but odds favor the index weakens in the sessions ahead. The weekly formed a shooting star last week; the potentially reversal candle showed up before testing channel resistance from August 2018 at 100.60s.
VIX: (VIX) Currently net short 130.2k, down 640.
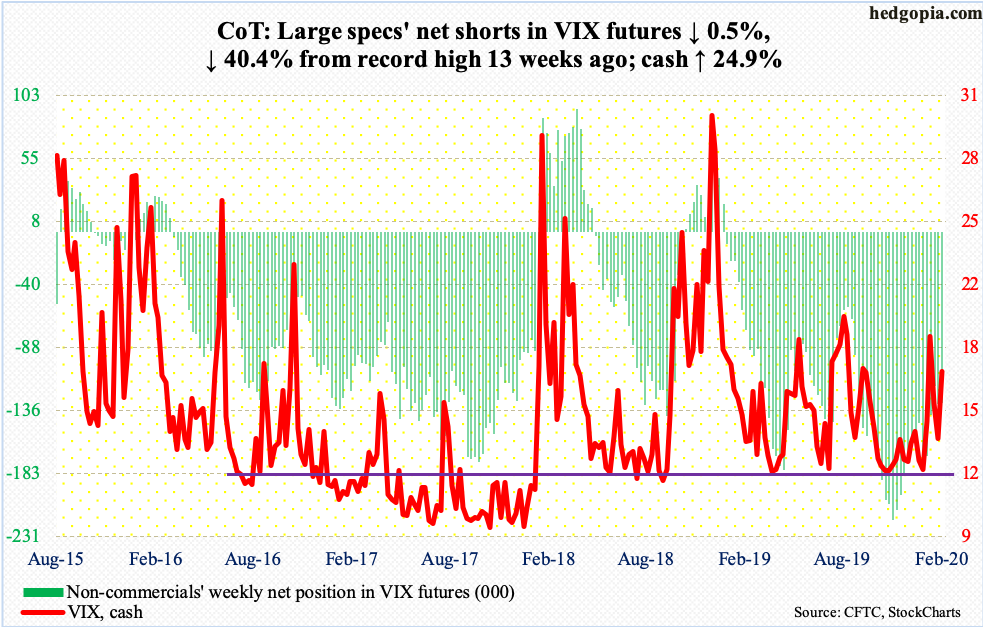
Since tagging 11.75 intraday on January 17, the cash (17.08) has made higher lows. The January 31st high of 19.99 also established a higher high, but volatility bulls were unable to hang on to it. They have another opportunity right here. The volatility index remains above both the 50- and 200-day (14.10 and 15.15, respectively). For now, the daily seems to want to go higher.
Thanks for reading!


