
Hi Ho Silver
(Click on image to enlarge)
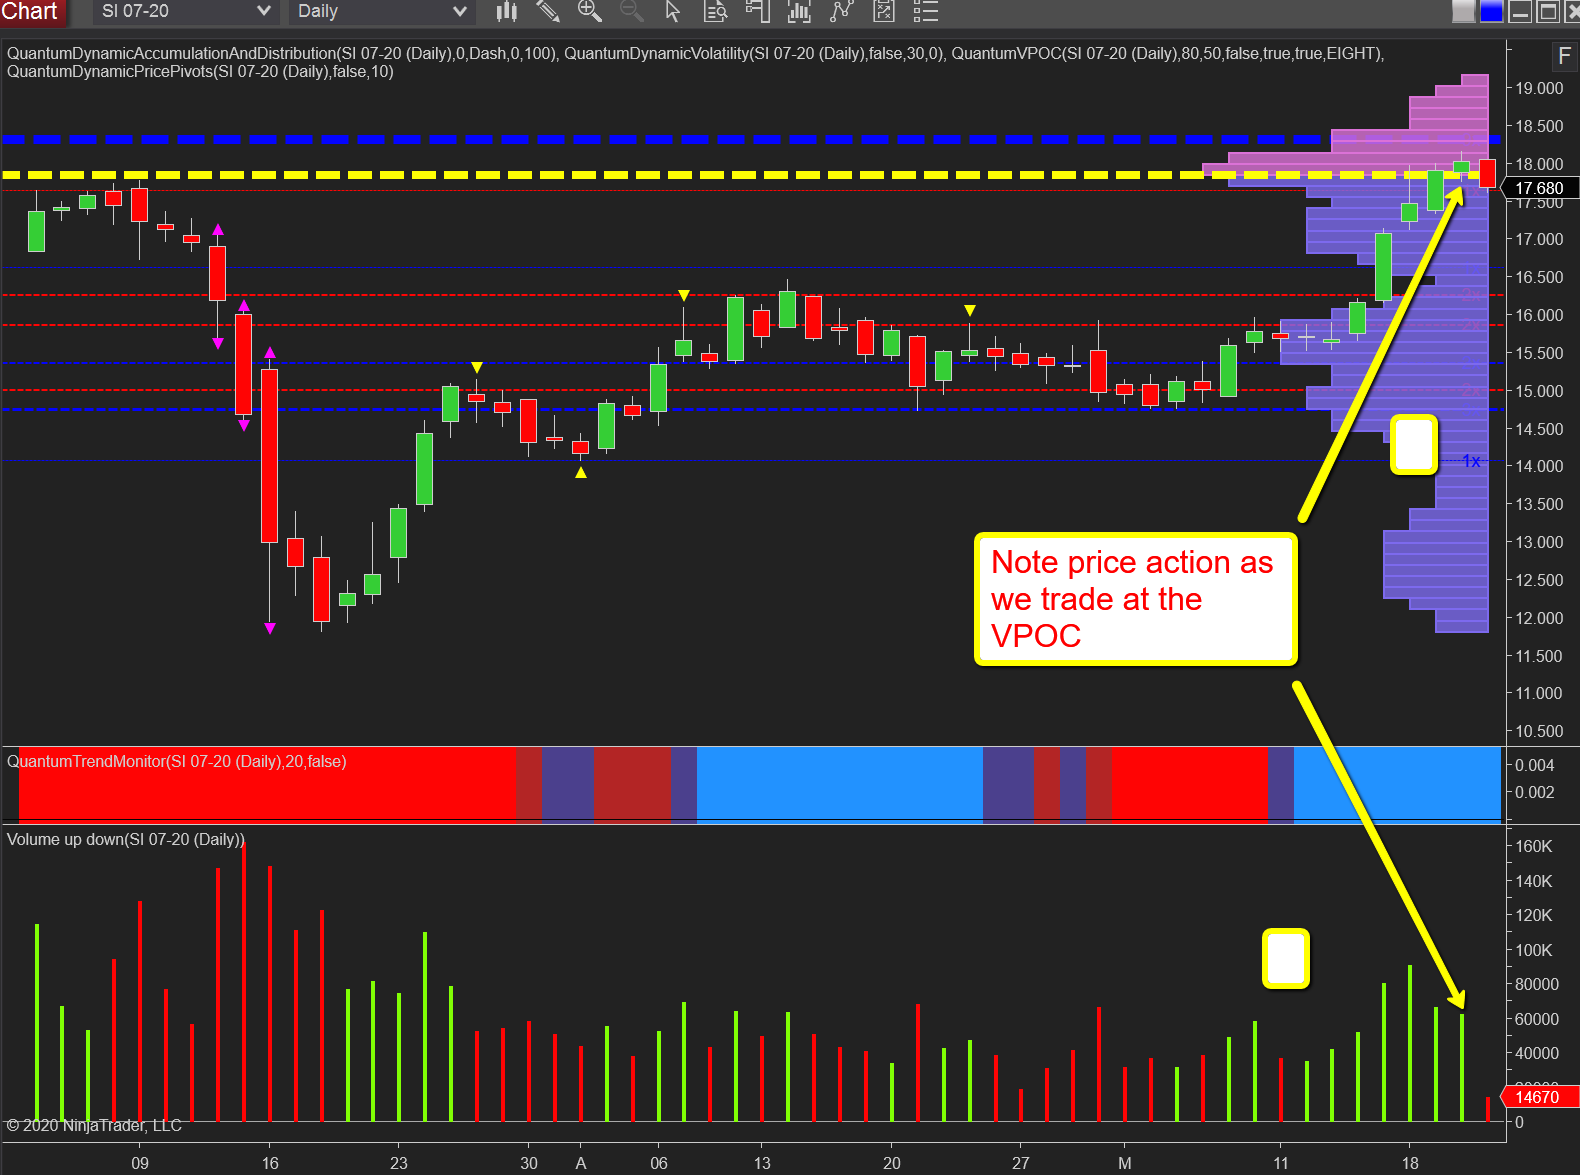
The resistance I outlined for silver on the daily chart in an earlier post this week, is now coming into play as the industrial metal attacks the $18.00 per ounce region with all these areas now coming into play.
First, we have the volume point of control indicated with the yellow dashed line. This is the fulcrum of market price action at present and as such we can expect congestion to follow in this region before the upwards bullish momentum can continue. Yesterday’s price action gave us a signal of what to expect today with a small doji candle on good volume sitting on the VPOC itself. Above we have the heavy blue dashed line of the accumulation and resistance indicator for NinjaTrader which awaits at $18.30 per ounce and likely to develop further over the forthcoming days.
The key now for traders and investors is to await the congestion and then the breakout which is likely to follow. If this is on high volume with a move beyond these regions of resistance, once the $18.50 per ounce level has been taken out, further bullish momentum is likely to follow through to $19.00 per ounce and beyond as volume falls away dramatically on the VPOC histogram and so presenting little in the way of resistance ahead from a volume perspective.
Disclaimer: Futures, stocks, and spot currency trading have large potential rewards, but also large potential risk. You must be aware of the risks and be willing to accept them in order to invest in ...
more

