
Hey Gold, Is Your Next Top In?
As the USD Index is testing its declining resistance line, the question now is whether gold’s corrective rally is running out of steam.
Very little changed yesterday (Feb. 10), and whatever changed served as a bearish confirmation for the short term. Let’s take a look at the charts for details.
Gold moved higher once again yesterday, but it reversed and declined before the closing bell. Does it mean that the next top is in or about to be in? That’s exactly what it means. Especially considering that yet another daily reversal in gold took place almost right at the triangle-vertex-based reversal and during USD’s breakout’s verification.
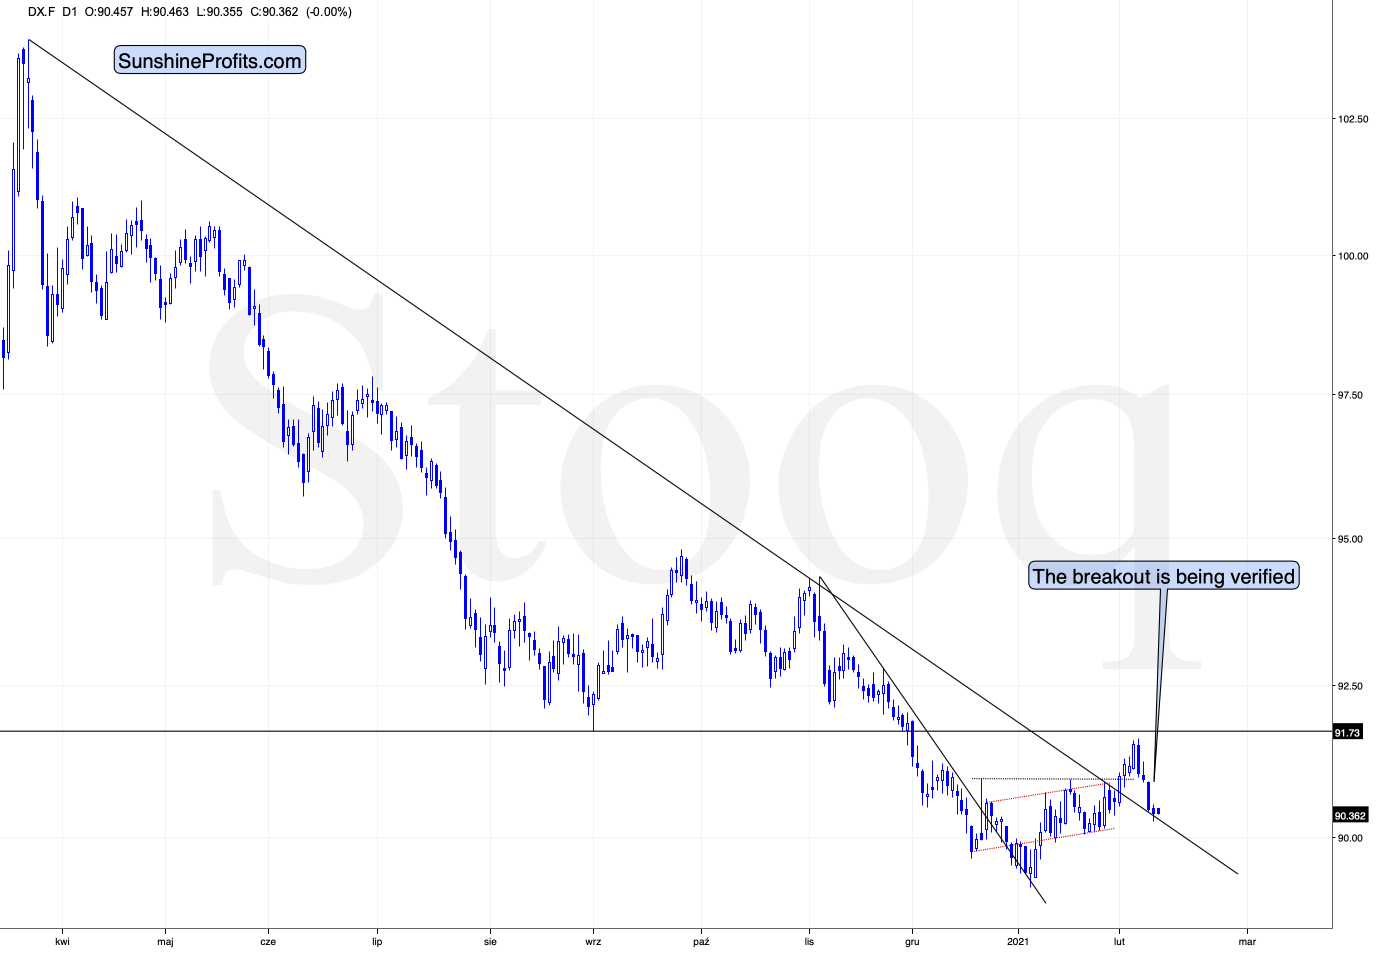
Figure 1 - USD Index
I previously wrote that because assets don’t move in a straight line, it’s plausible that the USD Index retests its declining resistance line, while gold retests its rising support line. If this occurs, the USDX is likely to decline to the 90.6 range, while gold will receive a short-term boost. I emphasized that the outcome does not change their medium-term trends and the above confirmations signal that the USDX is heading north and gold is heading south.
The part that I put in bold is exactly what is being realized right now. The USDX is correcting after the breakout, likely verifying the previous resistance as support.
Unless the USDX breaks back below the declining medium-term support line in a meaningful way, the bullish implications for the following weeks will remain intact. At the moment of writing these words, the USD Index is practically right at the support line, which means that it’s quite likely to reverse shortly.
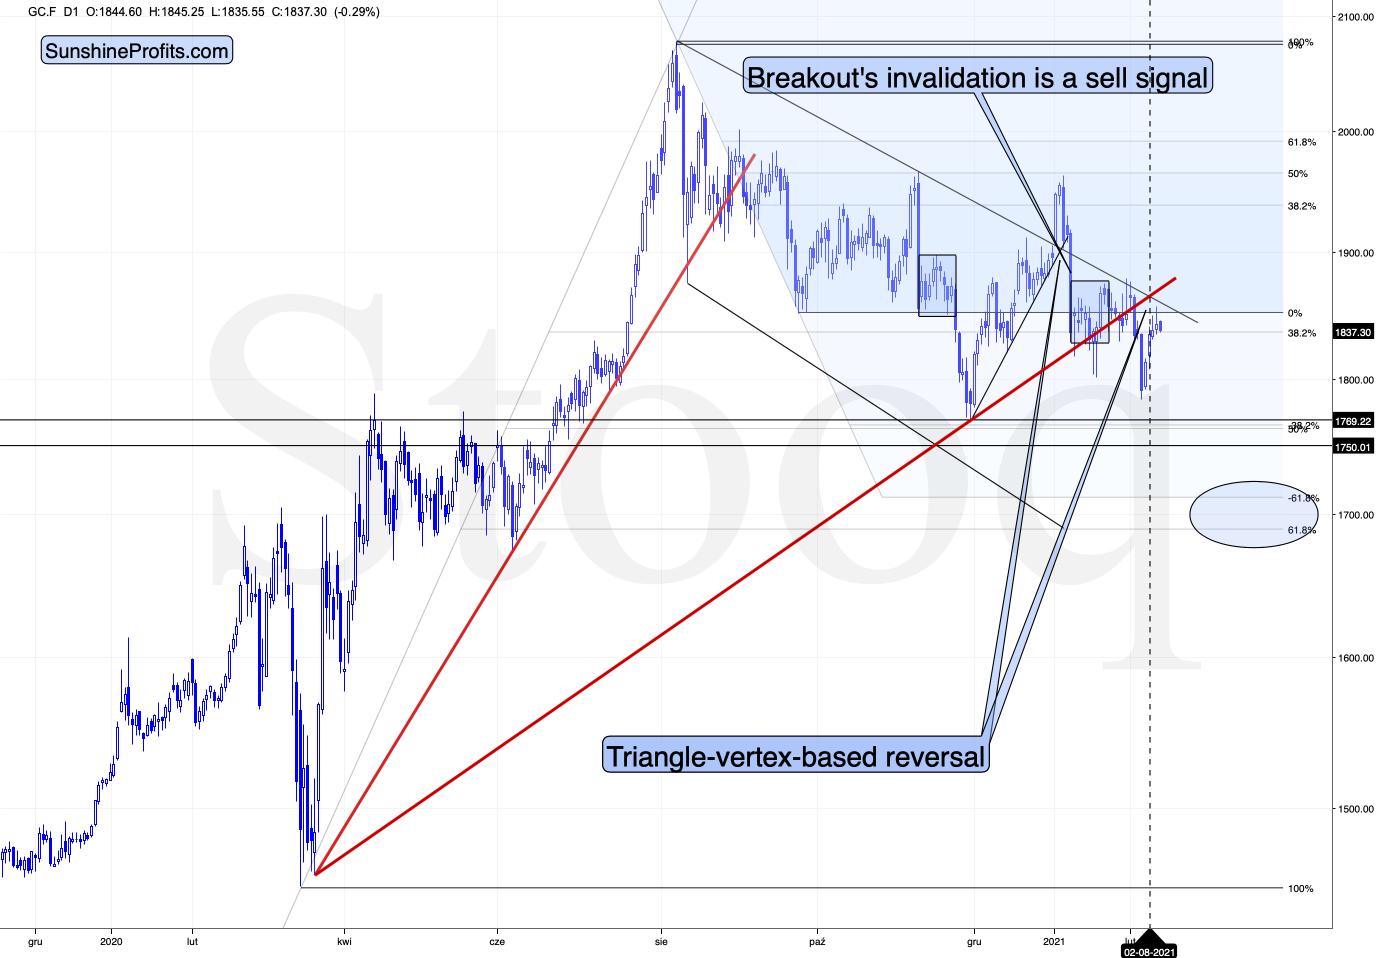
Figure 2 - COMEX Gold Futures
Gold formed a reversal yesterday, but it ended the session slightly higher. That’s the second “shooting star” reversal in a row. It’s also been two days in a row when gold has shown that it no longer wishes to react to bullish signals from the USD Index. The corrective rally appears to be over.
Let’s keep in mind that gold was just at its triangle-vertex-based reversal (based on the declining black resistance line and the rising red support line), which perfectly fits the shape of yesterday’s (Feb. 10) and Tuesday’s (Feb. 9) sessions – the shooting star reversal candlestick. The implications are bearish.
Today, gold moved slightly lower, and its currently trading lower than in the past 24 hours right now (valid at the moment of writing these words). This all means that the short-term top might already be in.
What about silver – did the white metal change anything?
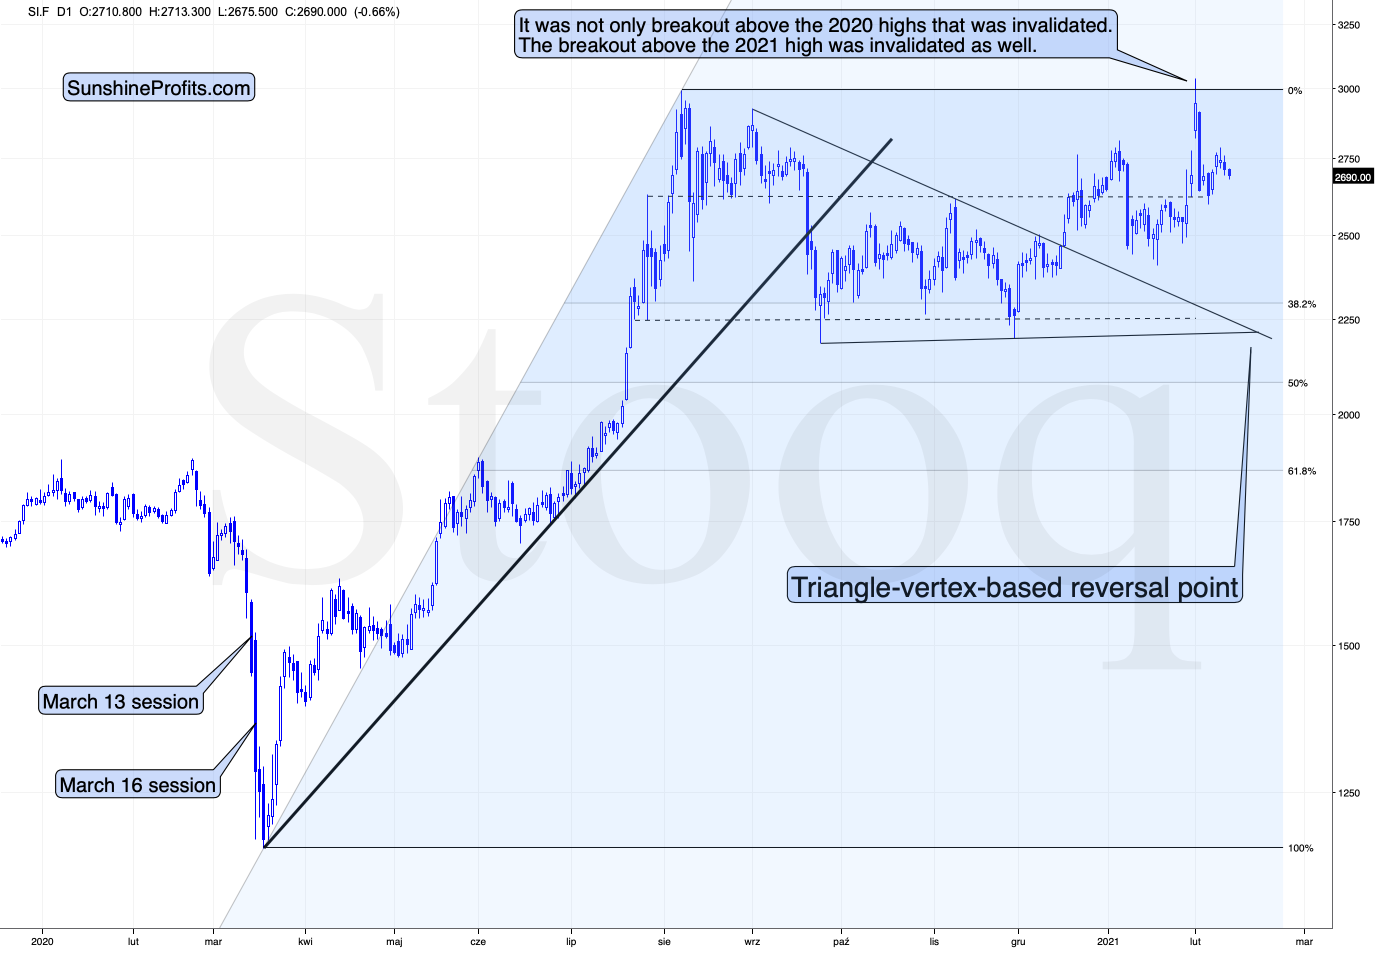
Figure 3 - COMEX Silver Futures
Not really. Just like gold, silver is taking a breather after the increased volatility. This is normal.
And the miners?
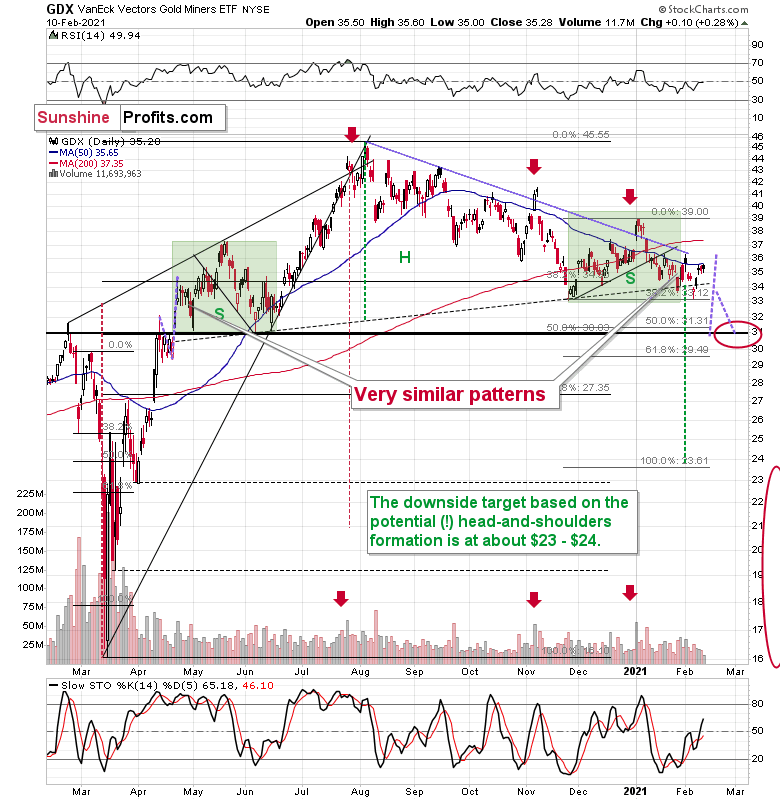
Figure 4 - VanEck Vectors Gold Miners ETF (GDX)
Mining stocks are not doing anything right now – they are moving back and forth in a calm manner – just like what they did at the beginning of the year. Back then this was a top that was being formed, and given what I wrote earlier today and – more importantly – what I’ve been writing about in the previous days and weeks (Monday’s flagship Gold & Silver Trading Alert features myriads of details), this could be the start of another bigger move lower. The next downside target is at about $31 in the case of the GDX ETF, after which I expect to see a rebound to the $33 - $34 area.
Ever since the mid-September breakdown below the 50-day moving average, the GDX ETF was unable to trigger a substantial and lasting move above this MA. The times when the GDX was able to move above it were also the times when the biggest short-term declines started.
So, did anything change yesterday? Not really.
My previous comments on the above chart remain up-to-date:
The most recent move higher only made the similarity of this shoulder portion of the bearish head-and-shoulders pattern to the left shoulder (figure 2 - both marked with green) bigger. This means that when the GDX breaks below the neck level of the pattern in a decisive way, the implications are likely to be extremely bearish for the next several weeks or months.
Due to the uncanny similarity between the two green rectangles, I decided to check what happens if this mirror-similarity continues. I used purple, dashed lines for that. There were two important short-term price swings in April 2020 – one shows the size of the correction and one is a near-vertical move higher.
Copying these price moves (purple lines) to the current situation, we get a scenario in which GDX (mining stocks) moves to about $31 and then comes back up to about $34. This would be in perfect tune with what I wrote previously. After breaking below the head-and-shoulders pattern, gold miners would then be likely to verify this breakdown by moving back up to the neck level of the pattern. Then, we would likely see another powerful slide – perhaps to at least $24.
This is especially the case, since silver and mining stocks tend to decline particularly strongly if the stock market is declining as well. And while the exact timing of the market’s slide is not 100% clear, stocks’ day of reckoning is coming. And it might be very, very close.
Disclaimer: All essays, research, and information found on the Website represent the analyses and opinions of Mr. Radomski and Sunshine Profits' associates only. As such, it may prove wrong ...
more


Well, I looked to see factual discussion on the precious metals and related markets, a clear presentation of ideas and arguing about their merits, justifications etc. This is unfortunately not happening - the readers instead of expanding their horizons in healthy professional discussion, are on the second consecutive article occasion treated to feelgood statements only.
This is TalkMarkets. Could we talk markets, actually?
Thank you, I'm very impressed with your detailed precious metal market analyses, Mr. Radomski. I am following everything you write here and on SunshineProfits.com closely, and I'm in the process of applying in my investments. Your future articles are much appreciated.
Thank you, I'm very happy to hear that you enjoy my work.
Dollar breakout would mean we're entering a dollar bull market, which I don't view as a proposition fittingly describing the reality - the greenback will remain on the defensive this year, and we saw not a retest, but a local top. Technical features such as steeply sloping lines inevitably get broken sooner or later, out of pure inertia or a weak corrective movement (no lasting trend change by default) - and it's my opinion we're seeing the latter run its course here.
This has powerful implications for the precious metals, where the only question is whether we get a weak corrective move to the downside still (nothing like the fearmongering $1,700 I see circled here), or whether we can base in a narrow range, followed by another upleg (think spring). February isn't the strongest month for precious metals seasonally, true, but it isn't a disaster either. I've been covering metals extensively daily for the whole world to see, so people are thankfully familiar with the current true internal strength in miners and other ratios.
Suffice to say that despite gold moving to $1,830 as we speak, it's chart is still leaning bullish. Consolidation with strong bullish undertones and my well argued reasons why.