
Have The Ides Of March Come For Silver?
Gold’s volatile little brother had an interesting run thus far, with internet forums buoying its price. But will fundamentals prevail? Where is silver headed?
“The Ides of March are come,” said Caesar. “Aye Caesar; but not gone,” replied the soothsayer. The Ides of March quotation is often bandied about in financial articles midway through the month. Caesar was assassinated on March 15th in 44BC (or BCE), at a meeting of the Roman Senate. Written about by Plutarch and further popularized by Shakespeare (who dramatized the event), the day has often been used as a harbinger of ill-fortune. So, if we’re to look at silver, should we be concerned about anything at this time?
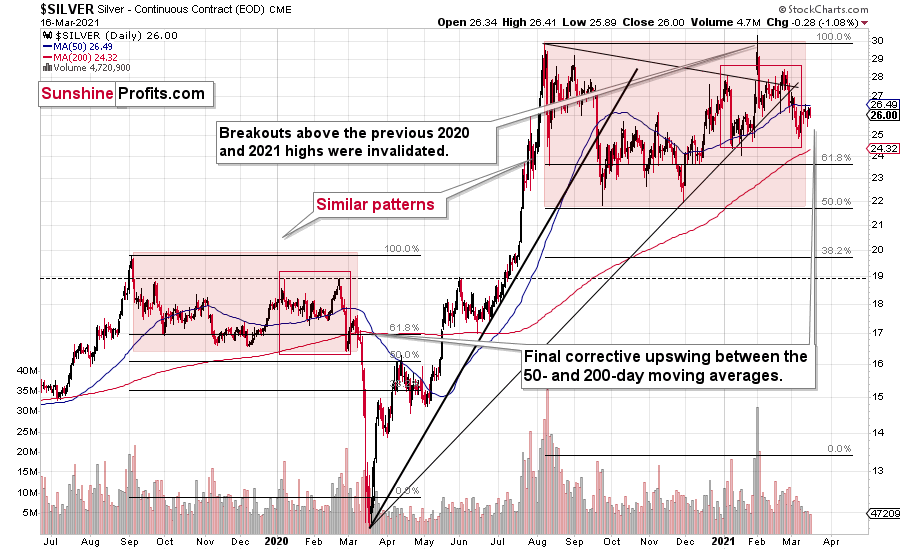
Silver is moving similarly to what we saw in the second half of 2019 and early 2020, before the huge slide. I marked the very broad tops that followed a quick rally in the red-shaded rectangles, and I also created solid-line red rectangles based on the last two – normal – tops and the initial decline that followed them.
Based on the sudden increase in silver’s popularity, it spiked 1.5 months ago, but this move to new highs was quickly invalidated. The nature of this move was more or less random – it didn’t stem from a change in fundamentals or from a specific technical pattern, but rather from a sudden growth of interest in silver based on forum posts. Because of that, and because this upswing was quickly invalidated, this quick upswing didn’t really break the self-similarity pattern.
Right now, we see a corrective upswing between – approximately - the 50- and 200-day moving averages (marked with blue and red). This upswing corresponds to the corrective upswing in gold and mining stocks (which allowed us to profitably go long in case of the latter). We saw – approximately – the same thing about 12 months ago, right before the huge slide.
And speaking of time, please note that the final corrective upswing of early 2020 took place in very late February and early March, while the two – normal – tops that created the red-line rectangle formed more or less at the turn of the year and in late February. This year, it’s all taking place at almost exactly the same time of the year.
If this self-similar pattern is indeed materializing, then the implications are very bearish, and we can expect a major downturn any day or week now.
Let’s be realistic - so far, the analogy might seem too unclear to be viewed as a reliable base for making a silver forecast.
But what if… What if there was a very similar pattern in the past that also preceded a massive decline? This would greatly increase the reliability of the above self-similarity.
There was indeed such a pattern!
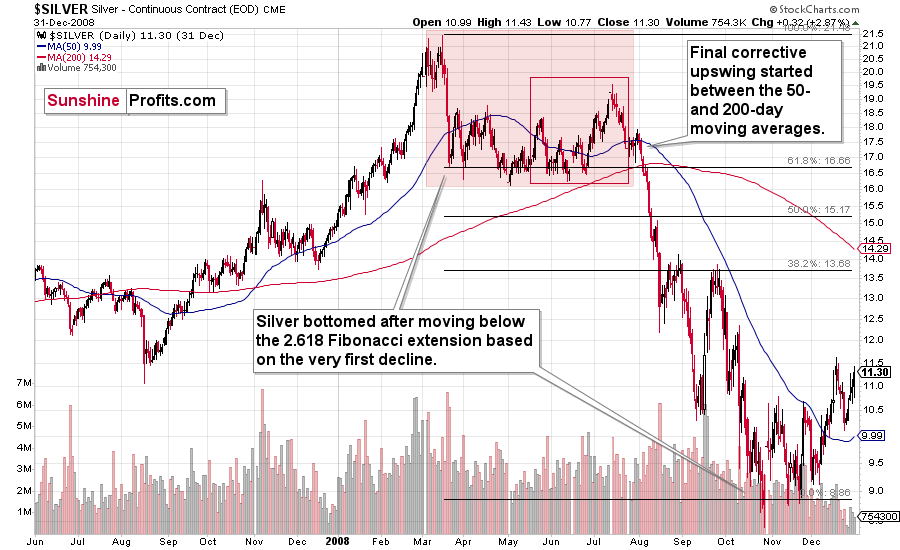
That’s what silver did in 2008 before it declined.
The August 2007 – March 2008 rally (please note the interim top in November 2007 that was followed by a zigzag decline, more or less in the middle of the rally) is similar to the March 2020 – August 2021 rally (please note the interim top in June 2020 that was followed by a zigzag pattern, more or less in the middle of the rally).
Afterward, we saw a double top in both cases that was followed by a sizable slide. Then silver formed a specific U-shaped broad top, where the final top was below the initial one (exception: in this case the forum-based rally took silver slightly above the previous high, but due to the specific/random nature of the move, it “doesn’t count” as something that invalidates the analogy).
After the top, silver declined, and the final corrective upswing took place approximately between the 50- and 200-day moving averages.
Please note that in both previous (2008 and 2020) cases silver then truly plunged, and it kept on declining until it moved below the 2.618 Fibonacci extension based on the initial downswing. The above charts illustrate that by showing the first decline at the 38.2% retracement (1 / 0.382 = approximately 2.618). Applying the same to the current situation (the initial decline took silver from below $30 to below $24) provides us with the minimum decline target at about $13.50. Will silver really decline as low? In my view, it’s imperative to watch other markets for indications as they might have more reliable targets (for instance gold), but I wouldn’t say that this target (or lower price levels) is out of the question. Of course, that’s just on a temporary basis – silver will likely soar in the following months and years (after this decline).
Before summarizing, please note silver’s tendency to decline sharply in March – that’s what happened in 2008 and 2020. Even if the entire self-similar pattern doesn’t continue, based on this seasonality, silver is likely to decline soon, anyway.
Summing up, if the similarity to what happened in 2020 and 2008 is upheld, then it seems that we’re about to see a big decline in the price of the white metal. Naturally, that’s not the only reason to expect silver’s weakness in the following weeks and months (not necessarily days) – you will find other reasons in my previous analyses.
Disclaimer: All essays, research, and information found on the Website represent the analyses and opinions of Mr. Radomski and Sunshine Profits' associates only. As such, it may prove wrong ...
more

