
Gold’s Cup And Handle Pattern
The cup and handle pattern is a very common pattern in technical analysis and a very bullish one.
The pattern is formed as a market, after an uptrend, corrects significantly but eventually bottoms and can rebound back to where the pattern began, the old high. Think of it like the letter “U.”
The handle is the consolidation that occurs after the cup is completed.
The handle should last no longer than one quarter of or one-third of the cup’s duration, and it should not retrace more than 38% of the move from the bottom of the cup to the top.
It is a bullish continuation pattern, which means the pattern itself leads to a continuation of the prevailing, bullish trend.
The upside price target is calculated by adding the distance from the bottom of the cup to the top to the top.
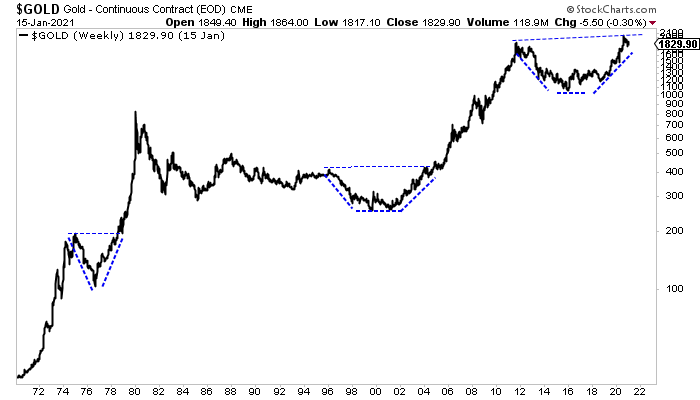
The current cup and handle pattern is stronger than usual due to the cup’s right side (2020 high) exceeding the left side (2011 high).
That was also the case with the 1996 to 2004 cup, though that pattern was not quite a continuation pattern. It formed out of a bottom.
The 1975 to 1978 cup and handle pattern was so strong that Gold exploded higher before forming any handle. That move would go parabolic.
Gold Weekly Line
The 1996 to 2004 action is also a great analog to 2012 to 2020.
As you can see below, the current correction aligns well with the correction in 2004.
If Gold continues along the same path, it would make a higher low soon and hit $3,000 in the first quarter of 2023.
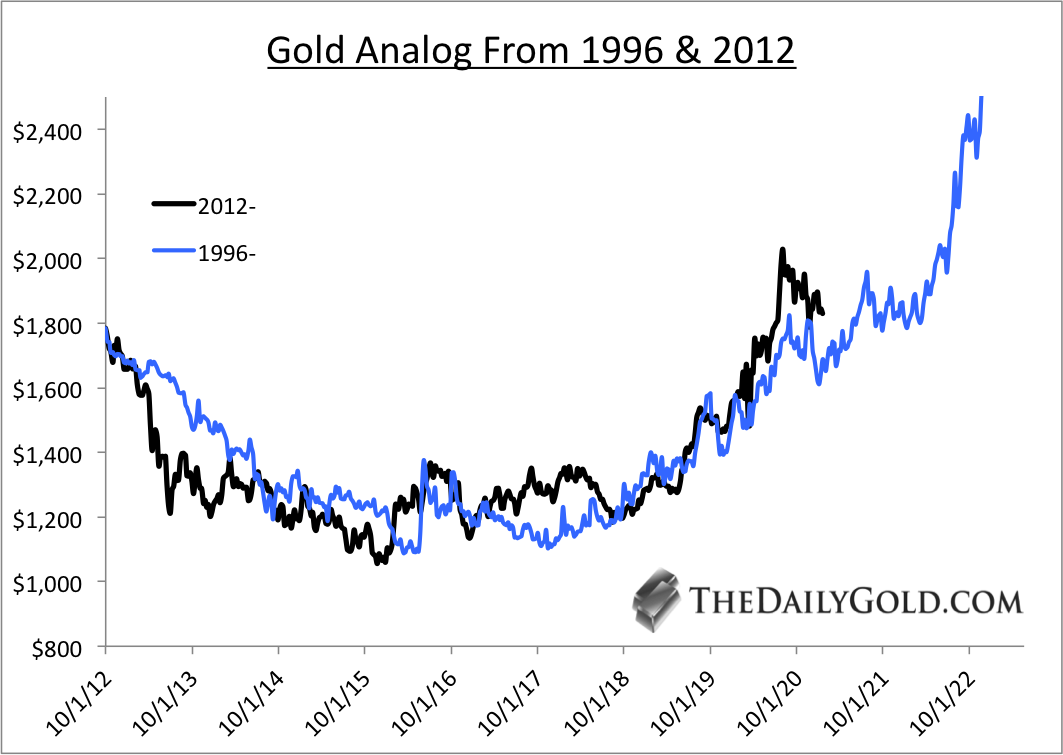
Gold Analog to 1996-2006
Gold’s corrective low in price in 2004 was 1% below its 300-day moving average and nearly 3% above the 38% retracement from the 2001 low. The 300-day moving average is currently at $1745, which is roughly 3% higher than $1690, the 38% retracement from the 2016 low.
Gold’s handle from 2004 to 2005 was roughly 16.5 months. The current correction is closing in 6 months.
A correction and consolidation are usually needed to facilitate an explosive breakout (within the cup and handle pattern). As we noted a few weeks ago, the move towards a breakout is probably 6 to 12 months away.
In any case, Gold will probably make a low over the next several weeks and then rebound.
If Gold continues to follow that analog, then odds are the coming low is a higher low and therefore a significant buying opportunity.
Also, the measured upside target from the current cup and handle pattern is as high as $3,100 and the analog projects to $3,000 in 2 years.
Disclaimer: TheDailyGold.com and TheDailyGold Premium are not investment advice. The website, email newsletter and premium newsletter are ...
more

