
Gold's 1780s Are Driving Us Crazy!
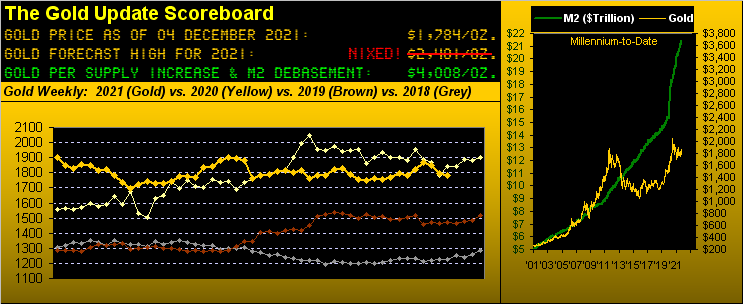
In completing its 48th trading week of 2021, Gold settled yesterday (Friday) at 1784. 'Twas the eighth week this year that Gold has settled in the 1780s (the first occurrence being on February 19). Indeed, Gold's median weekly settle price year-to-date is 1788. Yet as anybody engaged in the Gold Story knows, Gold first traded in the 1780s a decade ago on August 9, 2011, the U.S "M2" money supply that day stood at $9.5 trillion; (today 'tis $21.5 trillion).
So to reprise that from the "You Cannot Be Wrong Dept.": should anyone ask you "off the cuff" what is the price of Gold, your instantaneous response of "1780" shall (so 'twould seem for the foreseeable future) not only be correct, but enhance your dazzling intellectual image.
To reprise as well "The M Word" crowd, clearly their parking place of preference is Gold's 1780s. Of the 233 trading days year to date, 27 of Gold's closures exceeding 1800 have -- within the five ensuing trading days -- found price settle in the 1780s, or lower. "1800? SELL!" Sheesh... Gold's 1780s are driving us crazy!
Regardless, Gold (GLD) -- and moreover Silver (SLV) -- are doing what markets do when their technicals turn negative: their price goes down. Per our Market Magnets page, Gold from 1861 on November 18, found price then pierced down through its Magnet: "SELL!" From our Market Trends page, Gold from 1847 on November 19, found the "Baby Blues" of trend consistency begins to plummet: "SELL!" From our Market Values page, Gold from 1805 on November 22, crossed below its smooth valuation line: "SELL!" More mainstream technical signals have since followed to "SELL!" And recall -- just prior to it all in our anticipating near-term selling -- we nonetheless deemed the 1800s as "safe": "WRONG!"
Having thus now driven you crazy, we obviously deem holding and buying Gold as "RIGHT!" especially as the stock market -- be this another false signal or otherwise -- finds the S&P 500 (SPX) doing its dance of a snake in death throes. To be sure we've seen such before, only to see the Index magically survive, indeed thrive. You veteran readers of The Gold Update may recall some six years ago (on January 23, 2016) our characterizing the S&P as being in such "death throes", the ensuing three weeks then finding the Index fall 5% from a "live" price/earnings ratio of 43x; (today 'tis 47x).
"But don't forget it's now time for the Santa Claus Rally, mmb..."
Yet another conventional wisdom notion there, Squire, via your appreciated "leading comment". Irrespective of what "everybody says" and expects, Santa Claus doesn't always come to Wall Street. Since 1980, as measured yearly from December 1-24, Santa has skipped gifting the stock market 11 times. "WHAT?" 'Tis true. For those of you scoring at home, the S&P recorded net losses across that festive stint in '80, '81, '83, '86, '96, '97, '00, '02, '08, '15 and '18, the latter being a 409-point (-14.8%) loss. (Advice to the stocking stuffer: buy coal ... nudge-nudge, wink-wink, elbow-elbow).
Moreover, have you been monitoring the major market dislocations of late? Talk about the maligning of conventional wisdom! In yesterday's session, the €uro, Swiss Franc, ¥en -- and yes the Dollar Index too -- all closed higher. "WHAT?" 'Tis true. Still, even as there is Dollar demand given the prospect of it paying a positive interest rate, the yield on the U.S. Treasury Bond continues to fall: 'twas 2.177% on October 8, but is down now to 1.678%. In fact across our BEGOS Markets (Bond, Euro/Swiss, Gold/Silver/Copper, Oil, S&P 500), the price of the Bond is the only component with a positive 21-day linear regression trend. "WHAT?" 'Tis true. And then there's Oil (OIL): by our Market Values page, Black Gold settled yesterday 15 points below its smooth valuation line (66.22 vs. 81.51), even as Oil Inventories fell. "WHAT?" 'Tis true, (albeit OPEC is gonna keep a-pumpin'). Still, by that measure, Oil's price is massively, -- indeed deflationarily -- dislocated near-term from value. Too as noted, the Price of the S&P continues to be ridicously dislocated from the support of its Earnings; but if you get your dumbed-down P/E of 28.1x from the media, when 'tis honestly 47.4x, go ahead and say it: "WHAT?" 'Tis true.
'Course, the ongoing and most overwhelming dislocation is the price of Gold vis-à-vis our Scoreboard Dollar-debasement valuation (1784 vs. 4008). Say no more, Igor. A December to remember? Early on, 'tis the season to be dislocated.
To which naturally (as subtly stated) we find Gold located in the 1780s. Why expect it to be anywhere else? So spot-on is Gold in the 1780s that per the following graphic of weekly price, the rightmost close is right on the dashed regression trendline. So are the 1780s driving you crazy, too? At least Gold's parabolic trend still is Long, although the aforementioned negative technicals have kept on the lid, (to say nothing of "The M Word" crowd?). Note as well the 79.1x reading of the Gold/Silver, ratio, essentially at a two-month high, the white metal having been terribly on the skids of late:

Anything but skidding these last couple of months has been our Economic Barometer, it now having reached its highest oscillative level in better than three years. Whilst nominally last week's 13 incoming metrics were quite mixed, their overall effect net of prior period revisions and consensus expectations was to launch the Baro higher still as we here see:

Amongst the improvers were November's Unemployment Rate and Average Workweek, plus both the Manufacturing and Services readings from the Institute for Supply Management, along with October's Construction Spending, Factory Orders and Pending Home Sales. However: November's ADP Employment data, Labor's Non-farm Payrolls and Hourly Earnings, the Chicago Purchasing Managers' Index and the Conference Board's read on Consumer Confidence were all weaker.
Therein, too, is the red line of the S&P 500, its aforementioned snaky death throes throwing the Index all over the place this past week. The S&P's intra-day runs were as follows: Mon +48, Tue -86, Wed -143, Thu +91, Fri -113. Want some perspective for that? The entire trading range of the S&P 500 for the year 2004 was less than this past Wednesday's session alone. "WHAT?" 'Tis true. 'Course, back in 2004, 'twas a greater percentage range, but at least the average P/E for that year was a "reasonable" (vs. today) 26.4x. Thus again is begged the question: "Has the S&P crashed yet?" Obviously not, but we're feelin' very leery 'bout January. "As goes January..."(although you regular readers know we've demonstrably debunked that conventional notion as well). BUT...
As for the Federal Reserve's removing of the punch bowl, Atlanta FedPrez Raphael "Ready to Raise" Bostic again says its time to step up the Taper of Paper Caper, whilst FedGov Randal "Have No" Quarles says 'tis time for The Bank to prepare to raise. And as noted in last week's missive: were it not for the "Oh my! Omicron!" scare, we could well see a FedFunds rate hike in the FOMC's January 26, Policy Statement. So just keep wearing your masque such that everything's great, and in turn let the Fed increase its rate!
Here's another positive from the "Good Is Bad Dept.": the StateSide government shan't run out of money this time 'round until 18 February. Low on dough? To Congress you go! Just ask TreaSec Yellen, for she's in the know! Ho-ho-ho...
Either way, west of The Pond "inflation" remains the watchword -- or if you prefer the real word -- as the word "transitory" is being transited away. East of The Pond, the EuroZone (just 23 years young) sees its inflation level hitting record high levels; but should it be peaking, 'tis thought any European Central Bank rate rise shan't next year materialize.
And lacking any upside mobility of late (duh) are our precious metals, the following two-panel graphic bearing along as butt ugly. On the left we've Gold's daily bars from three months ago-to-date, their cascading "Baby Blues" reinforcing price's downtrend, (although price never really departs the 1780s, right?). On the right similarly is the same story for Sister Silver, who clearly is suffering the ravages of DDS ("Dangerfield Disrespect Syndrome"), by which she's none too happy. For from the precious metals' respective highs of just three weeks back, Gold has dropped as much as -5.8% ... but Silver more than double that at -12.6%! "WHAT?" 'Tis true:

Meanwhile, still dwellers in their Profile cellars are Gold (below left) and Silver (below right). Here is the entirety of their trading across the last two weeks, the high volume price apices as labeled. And that is a lot of overhead work to do:

So after all of that, are you ready to tune out? You can't be so blamed. Gold's 1780s have got us all crazy! Puts us in mind of that iconic glamour rock hit by Sparks from back in '83 -- supportive of the film by the same name -- "Get Crazy"Tune it in on your radio dial: sure to bring a you a Golden Smile!

Cheers!
...m...
Disclaimer: If ever a contributor needed a disclaimer, it's me. Indeed, your very presence here has already bound you in the Past, Present and Future to this disclaimer and to your acknowledging ...
more

