
Gold Vs. Silver - Absolutely No Comparison
In the five months between March and August this year, the price of silver increased from a fourteen-year low of $11.77 per ounce to a seven-year high of $29.26. That is a whopping gain of one hundred sixty-three percent.
Meanwhile, gold's price rose from its low of $1472 per ounce to a recent high of $2061. That represents a gain of forty percent, which is certainly a handsome number. Nevertheless, silver's performance outshone gold by a ratio of four-to-one.
However, five months doesn't tell the whole story. For those who were and are, hopeful that this is just the beginning of silver's day in the sun, be warned. Looking at the bigger picture historically, silver can't hold a candle to gold.
We referred above to silver's price outperformance relative to gold for the most recent five months. Here is a chart that shows that same performance within the context of the past five years...
(Click on image to enlarge)
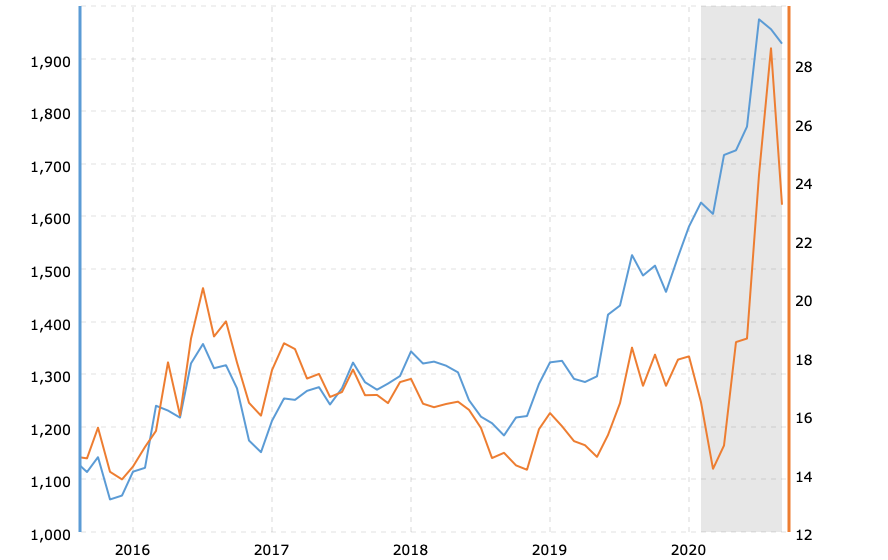
(source)
As you can see, when both metals started their five-month run to recent peaks, gold (blue line) was already up eighty percent from its low in 2015. At that time, silver (gold line) was actually lower than it was five years earlier.
For the four years leading up to 2020, gold's price gains of eighty percent dwarfed silver's net loss by an infinite number.
Hence, much of silver's outperformance relative to gold was, in some respects, just a matter of regaining lost ground. The net effect remains that for the five-year period, gold actually outperformed silver. Not by a lot, but it certainly calls into question interpretations and projections for more outperformance by silver going forward.
Gold vs Silver - 10 years; 100 years
One might look at these results and consider that choosing between the two metals is a toss-up. Over a reasonable length of time, maybe it doesn't make much difference whether you own gold or silver.
So, let's look at another chart. The one below is also a comparison of gold prices vs. silver prices. This one covers the past ten years...
(Click on image to enlarge)
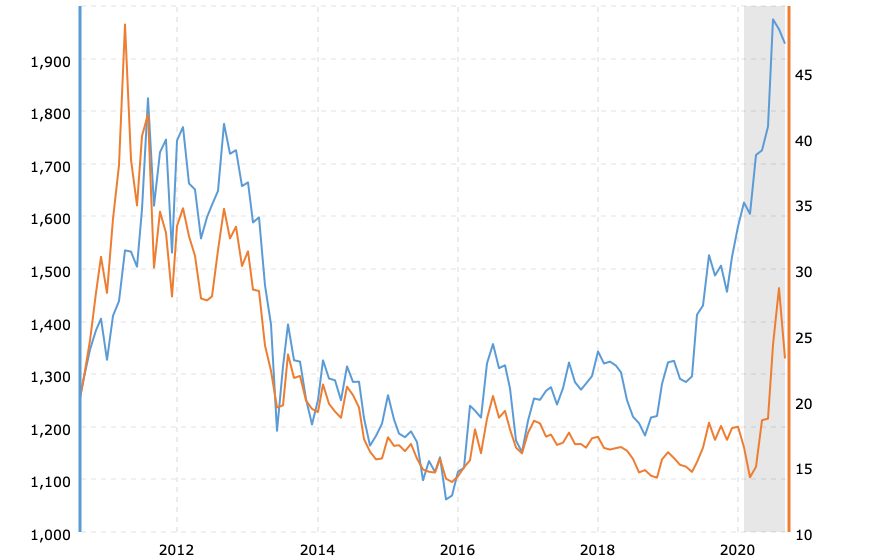
(source)
Here we see that gold for the ten-year period is up fifty percent. Silver, on the other hand, for the ten-year period, is unchanged.
Comparing current prices for both metals to their peaks in 2011, gold is unchanged and silver is lower by fifty-five percent.
The farther back we go, the worse it looks for silver. The next chart shows gold prices vs. silver prices over the past one hundred years...
(Click on image to enlarge)
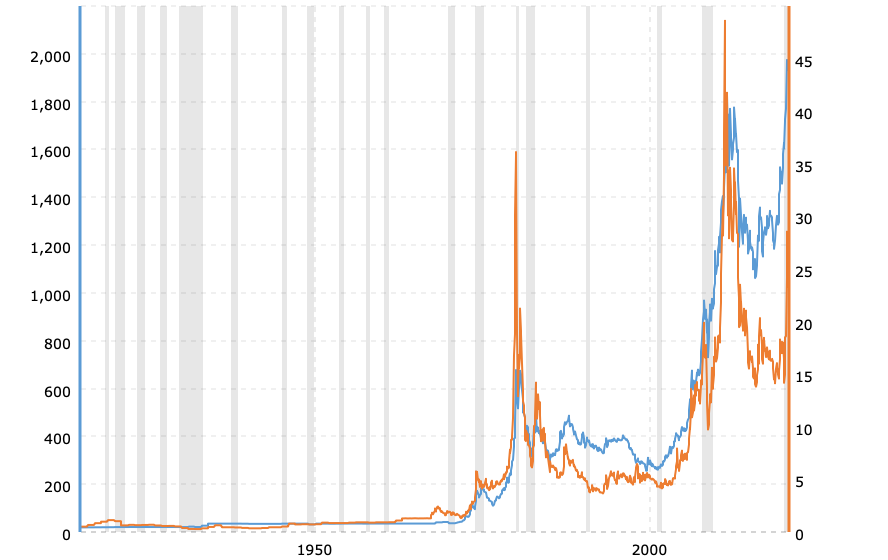
(source)
When looking at this chart it is important to focus on the widening gap between gold prices (blue line) and silver prices (gold line); NOT the relative symmetry of their price action. Over time, the gap continues to widen in favor of gold prices.
This widening gap translates to a higher gold-to-silver ratio which can be seen on the chart below...
(Click on image to enlarge)
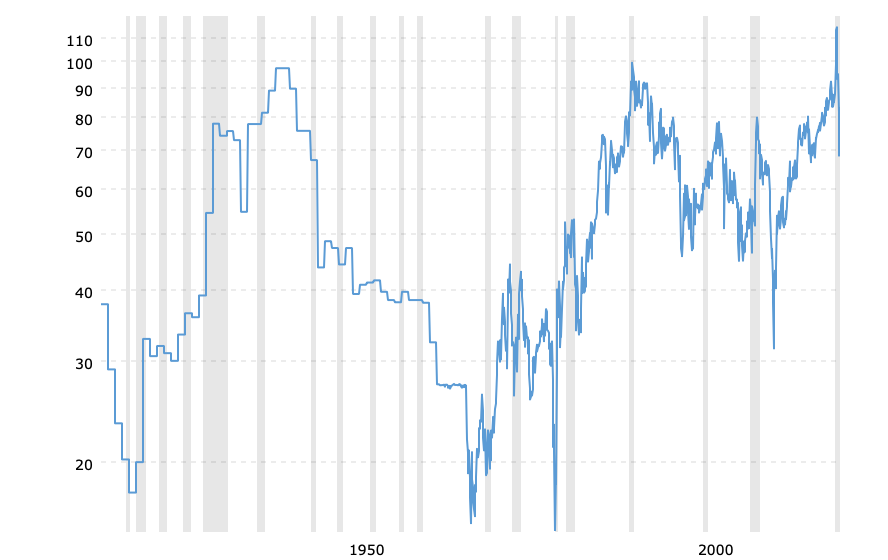
(source)
"Silver investors who are depending on a declining gold-to-silver ratio are betting that silver will outperform gold going forward. But, if anything, the chart above shows just the opposite. For the past fifty years, the ratio has stayed above a rising trend line taking it to much higher levels." (see Gold-Silver Ratio: Debunking The Myth)
The price range for gold over the past ten years reflects a decline in the purchasing power of the US dollar of somewhere between ninety-eight ($1000 per ounce) and ninety-nine percent ($2000 per ounce) since the inception of the Federal Reserve in 1913.
If the price of silver were to compare favorably with the changes in the price of gold since 1913, silver's price today would need to be at least $100 per ounce. It is not close to that; nor has it ever been remotely close to that price.
At its most extreme, the silver price at its high point ten years ago, reached $50 per ounce. Worse, $50 per ounce is the same price point peak it hit thirty years earlier in 1980.
Over thirty years, from its price peak of $50 in 1980 to its price peak of $50 in 2011, silver had zero gains. In inflation-adjusted terms, that is a loss of fifty percent.
At its recent high in August, gold reached $2067 per ounce, a one-hundred fold increase from its fixed and convertible price of $20.67. That reflects a ninety-nine percent decline in the dollar's purchasing power.
Silver, however, managed to climb only as high $29 per ounce and is currently at $23.50 per ounce. At its current price, silver is more than fifty percent lower than it was ten years ago; whereas gold at $1880 is right about where it peaked in 2011.
The action in prices for both gold and silver recently, and over the past ten years, is a continuation of the long-term trend which is evident in the charts above. The trend is supported by the fundamentals. Those fundamentals are...
- Gold is real money and its price reflects changes in the purchasing power of the US dollar. It is a store of value for wealth-conscious investors.
- Silver is an industrial commodity with a secondary use as money. It is not a store of value.
Having some silver coins on hand is recommended. Expecting silver to outperform gold and make you wealthy is fantasy. Owning gold is a matter of wealth preservation. (also see Gold And Silver - Fundamentals Be Damned)
Kelsey Williams is the author of two books: Inflation, What it is, What It Isn't, And Who's Responsible For It and more


