
Gold: Viruses And Interest Rates
Viruses and Interest Rates
Gold received a boost over the past week when the coronavirus threat sent the price higher to $1,588 per ounce. The market needs to consolidate the current prices to reflect the seriousness of this virus on a global scale and to challenge the January high of $1,613.
The markets in general last week took a hit, including the equity markets, based on fears of the coronavirus. There was a correction in the equities and in gold, bringing gold down to the weekly average price of $1,465. This movement discounted the effect of the coronavirus and identified where buyers stepped up and began to accumulate positions on the long side.
The price of gold is being supported by the yield curve, which has been inverted for the first time since October. It has raised expectations for a US rate cut. The US 10-year real yield fell to a negative 0.05% and raised high expectations of another rate cut in a world of global negative-yielding debt, which has risen to $2.3 trillion. This led to a two-day sell-off in US stocks.
As a consequence, the US dollar has been strengthening against the Japanese yen, creating some flight to quality in the currency markets. Needless to say, the reaction of the gold market to an overwhelming bullish environment is a pause for caution on the long side. What we want to see is the market test the highs previously made on the Iran news and look to exit long positions at that time.
As we maintain a long-term bullish outlook, the market, once it has tested the upper end of the extreme above the mean and possibly the supply that’s available, about $1,588 or $1,600, it will determine whether we currently have an inverted bottom this week into a potentially inverted top in the next couple of weeks. We also want to maintain a cautious eye on US stocks, led by recent earnings from the technology companies, to recover from this correction.
The VC PMI AI Weekly Forecast
We use the Variable Changing Price Momentum Indicator (VC PMI) to analyze the markets, such as gold, although it’s applicable to stocks, ETFs and any other market. It serves as a GPS for your trading, telling you when it's the best time to enter and exit the market.
Gold traded last at $1,578 and is up 2.20. The daily mean is $1,576. The VC PMI determines the daily average price and then builds a structure of two extreme levels above the mean (Sell 1 and 2) and two extreme levels below the mean (Buy 1 and 2). The Sell 1 level is $1,582, which has been activated. That level is the target, which the VC PMI algorithm has identified for the day. We trade an account on Ticker Tocker, which our CEO Patrick MontesDeOca executes based on the daily intelligence from the VC PMI automated algorithm, which is independently verified.
(Click on image to enlarge)
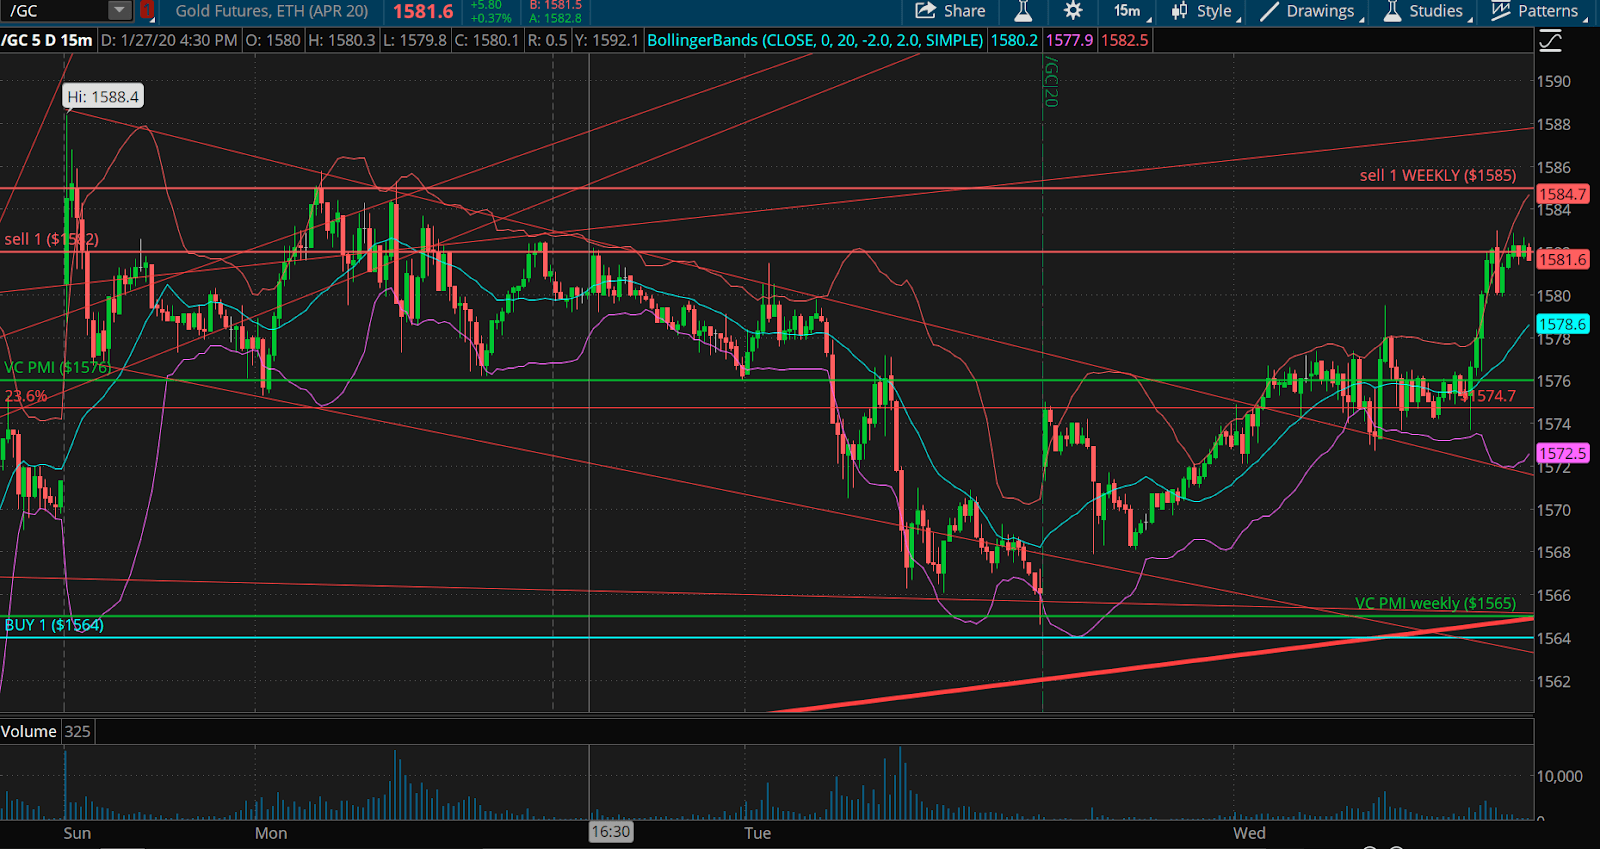
On the left are the daily data, with the VC PMI average price and the Buy 1 and 2, and Sell 1 and 2 levels. On the right are the weekly numbers, with the same structure of Buy 1 and 2, and Sell 1 and 2. The five levels represent a perfect Fibonacci sequence. The pivot points are transformed by the algorithm into red and blue, for the sell and buy levels. Any time the market closes above the daily Sell 2 level, it connects the algorithm to the weekly numbers. The structure for trading carries over from the daily to the weekly data and levels. The algorithm is written in C++ and is available from TradeStation’s app store.
Gold is trading above the average daily price, which has activated a bullish price momentum. We don’t recommend trading from the mean, since the odds are 50/50 whether the market will go up or down from the mean. We focus on trading the extreme levels above or below the mean, when the odds are 90% or 95% that the market will revert back to the mean. On the 24th, the market stabbed right into the $1,558 daily level. The weekly number below was $1,553. The weekly numbers do not change - they just change once a week. The daily numbers change on the close, and we upload those numbers daily to our platform.
The market came down to test that $1,565 weekly target that was anticipated on a close below $1,585 earlier. If you look at Patrick’s videos each day, you will see that this has been the objective that the VC PMI had in place this whole week. As the February contract expired yesterday, the market collapsed to that $1,565, not quite reaching the Buy 1 level of $1564, but activated a bullish price momentum. The target was completed from $1,585, which was a $20 oz or $2,000 in the futures markets a healthy gain in a matter of days.
When the VC PMI shows the market in red, there's a high probability of a distribution of supply. From that area, expect a reversion to test the previous levels below. On Monday, there was a gap based on the coronavirus scare, which gave you a chance to lock in profits, and then to enter the market again. Every time the price goes up into the area in red, it meets resistance and selling pressure. It never closed above $1,585, so it never stopped out of the position. The target was accomplished several times. It activated a short trigger, met that target, and then went up again to test that higher level. The VC PMI identifies the extreme levels of supply and demand, which is what we trade.
Now we are back above the weekly average price of $1,565 and the daily average of $1,576. Artificial intelligence has activated a bullish price momentum. If it goes to $1,565 or up to $1,582, then we will take action: trade the extremes of the market.
Risk Management Strategy With Triple X ETF: NUGT
(Click on image to enlarge)
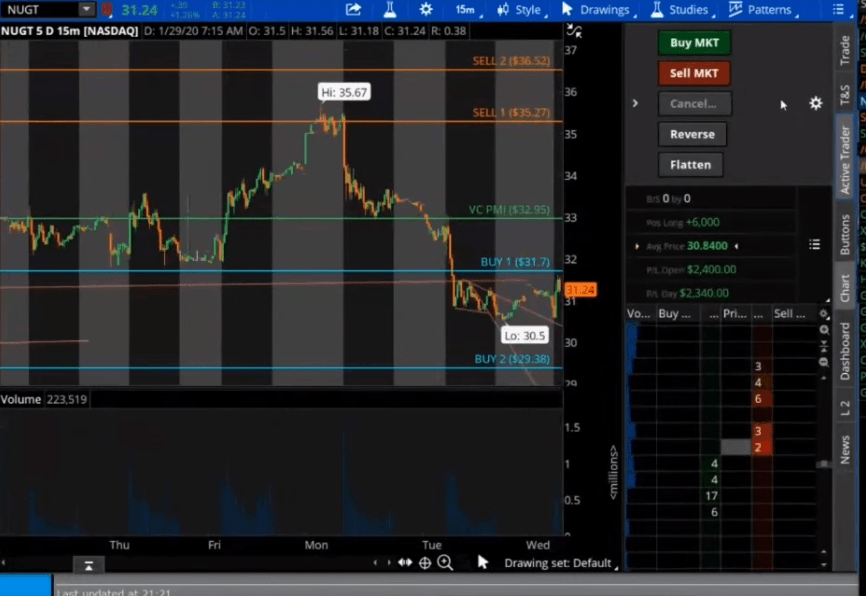
Most people are not financially equipped to trade futures. The risk of a futures contract is great. You are liable for the full value of the contract, which for gold at $1,572 is $157,000. You can buy a contract for $5,000 margin, but you are asking that if the market goes against you, which can happen relatively quickly, you can be wiped out unless you are hedged, have very deep pockets or have a protective strategy. We manage risk when we expect a market to turn around, is 3-to-1 aggressive ETFs. They are highly volatile. You don’t want to hold them long term. If the price of gold goes up 3%, then the ETF goes up theoretically 9%. The great thing about such instruments is that they are highly volatile, so we can take the margin for gold, say $13,000, and buy an ETF, such as NUGT, and produce far greater returns than we would by holding a futures contract. Plus, the ETF is flexible, since you can buy 3,000 or 6,000 shares, so you can get out in stages. We are long NUGT, and we are up $2,000 already, even though the gold market is almost unchanged since we bought NUGT. If gold is trading around the mean, we hold an ETF to build a position. As gold looks like it may be turning a corner and completing this correction, we recommend trading NUGT into the extreme above or below the mean. This is against conventional wisdom, but they work when they are used correctly. We are buying 3,000 shares of the ETF NUGT at 31.24 for our account.
Disclosure: I am/we are long NUGT.
To learn more about how the VC PMI works and receive weekly reports on the E-mini, gold and silver, check us out on more


