
Gold Triggers A Buy Signal
Looking at the market's response to the coronavirus this past week, I can't help but see that the outbreak in China has exposed a seeming disconnect between the financial markets and science. We don't know how bad the crisis will get or how bad economically it will affect the world. However, stocks have figured out that, regardless of any unprecedented economic catastrophe or epidemic, the central banks can cap the economic impact by simply lowering interest rates in any type of crisis. That is pretty much what the S&P 500 and stock indices discounted these past few days, given this massive rally in the face of this developing global pandemic.
(Click on image to enlarge)
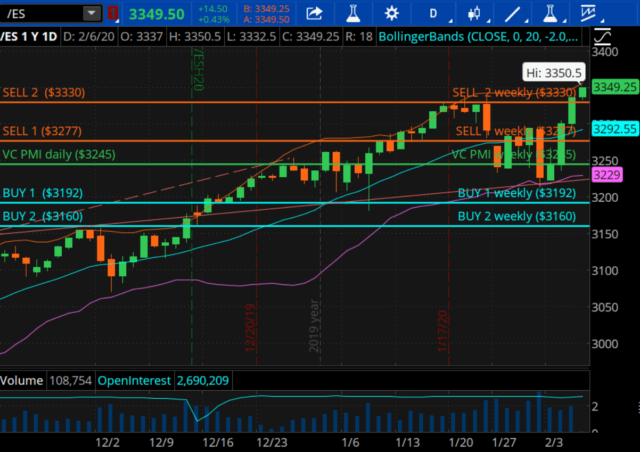
Courtesy: TDAmeritrade
The market, after making a low of 3,222 on the E-mini S&P, is currently trading at 3,349. This leads me to believe that the market has once again taken the position that central banks will save the day, regardless of the crisis. That is concerning since there is only so much the federal reserve banks can do as we approach zero or negative interest rates. Not knowing the full extent of the damage economically, there is a very high risk in being complacent about the economic indicators, especially since we have never seen this kind of crisis develop before. SARS, for example, was smaller and had less of an effect already. Investors have been too complacent about the economic effects of the coronavirus. After initial fears about a big blow to the second-largest economy, China, with 1.4 billion people, investors have taken the better-than-expected reports from various big companies, which came out before the coronavirus and assumed that all is going to be well. The market seems to be discounting the virus, assuming that it is under control, and even if it spreads further, that central banks will be able to cut interest rates and save the global economy. They have done so repeatedly since the 2008 financial crisis. Earlier this week, the Chinese central bank stated they would pump $173 billion into the economy to help calm the markets.
Where are we headed?
This crisis pretty much puts the US central bank under pressure to potentially be ready to lower interest rates if things deteriorate further. In my last report, I mentioned that I was disconcerted by the fact that the gold market never really reacted as I thought it should above $1,613, which kind of put a peak on the market for the intermediate-term. In September, I published an annual report with gold targets for 2020, with the first target in the $1,655 area and the second target above $1,800.
The price has once again come down to identify where the value is. In that September report, I said the ideal levels were around $1,550 and potentially the $1,525 area for the gold market. As I wrote this report at 6:41 pm, the low today was $1,551.10. Currently, the market reverted from there, trading last at $1,558.20.
As we move into the rest of this week, the weekly signals have activated a buy trigger point by activating the Buy 2 level at $1,556 and reverting to trade above it; trading last at $1,559. The target we have in place for the weekly data is the weekly average of $1,584 for the remainder of the week.
We created the Variable Changing Price Momentum Indicator (VC PMI) as an artificial intelligence algorithm to analyze markets. It acts as a GPS, showing you a structure around the mean with two levels above and two levels below the mean, which indicates where to enter the market to make the highest probability trades.
Weekly VC PMI Activated Buy Signal
(Click on image to enlarge)
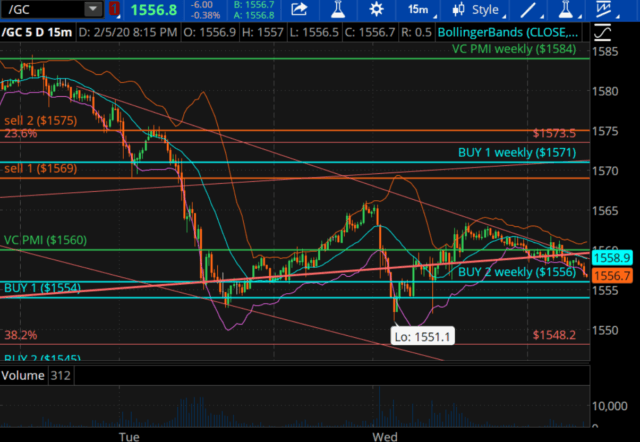
Courtesy: TDAmeritrade
Gold triggered a buy signal for the weekly when it closed at $1,558. Automatically, with the signal activated, you put your stop below on the close; in this case at $1,556, the Buy 2 on the weekly basis, which has a 95% probability of the market reverting back to the mean from that level. We are long at $1,556 based on this signal. When the price activates the trigger, the market should go right away.
The market broke below the daily average of $1,564, activating a bearish price momentum. A close below the mean is simply telling you that the price momentum is bearish. I do not suggest taking a trade at these levels, because there is a 50/50 chance that the market will go up or down from that mean. We look for the highest probability trades by entering the market at the extremes above or below the mean. In this case, gold activated a weekly buy signal at $1,556, with a stop on a close below $1,556.
Gold on a daily basis is hovering around the weekly level of $1,556. Right under that level is the 38.2 Fibonacci retracement at $1,548 from the peak of $1,613. Right below that, we have the daily Buy 1 level of $1,544, and below that is the Fibonacci trend lines that coincidentally roughly match the Buy 1 level at $1,544. Right below that level is the Bollinger Band with a cluster of indicators all indicating that the price can revert from here with this tremendous support underneath. Therefore, this area has a high probability of finding demand or buyers. The first target above is $1,571 (Sell 1), and the mean weekly target is $1,584.
Gold is in a major area of support, which is validated by a number of independent indicators, including the VC PMI. The market appears ready to hold and a reversion to that $1,584 level, the weekly mean, is highly likely.
Managing Margin Risk by Buying NUGT
(Click on image to enlarge)
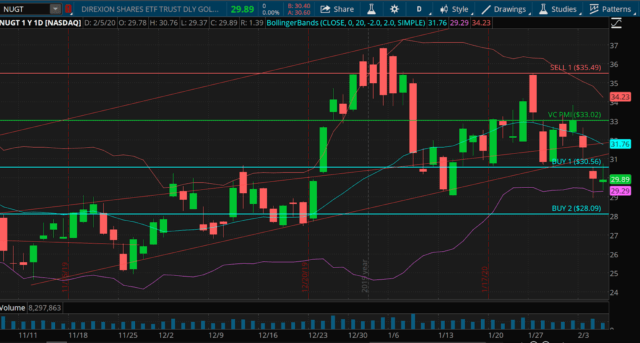
Once the VC PMI has identified the levels where there is a high probability of a reversion back to the mean, we first look at how to manage risk. With futures, it is difficult to manage risk overnight, and most of the moves in these markets appear to happen on the overnight on the Globex or the evening session. Therefore, in order to manage risk for a swing of a week or a month, or even a position trade, we wait for the market to come down to the region in blue, Buy 1 or 2, and once the trigger is activated, your stop automatically becomes the level below. We manage that margin risk by buying NUGT and holding it as a cash value asset. It is a triple X velocity ETF. It is very volatile. I do not recommend holding it long term but to trade it using the volatility of the futures contract. Trading the extremes above and below the mean has been the most successful for me.
The structure for NUGT weekly is that the Buy 1 level is at 30.56 and the Buy 2 level at 28.09. The market traded today as high as 30.76, almost activating the Buy 1 level of 30.56. The VC PMI artificial intelligence shows that if the market closes above 30.56, then a 90% probability of the market reverting to the 33.02 target would be activated. NUGT has been trading between 30.56 and 28.09. We are waiting to add to our long-term position either on a close above 30.56 or a test of Buy 2 level of 28.09. With the gold market anticipating a cyclical bottom or completion of this correction, I think this is the best way to manage margin risk by buying a derivative like NUGT.
Disclosure: I am/we are long NUGT.
To learn more about how the VC PMI works and receive weekly reports on the E-mini, gold and silver, check us out on more


