
Gold: Time To Unload The Truck
Major Long-Term Targets Completed
The gold market traded last at $1,807.70. It has activated a weekly short trigger at $1,808.00. The weekly short signal that we had for this week has been the level of $1,808.00. The average daily price for today is at $1,811.00, the extreme level above that is Sell 1 level of $1,831, the level above the mean Sell 2 level is $1,843. The Buy 1 level $1,796-$1,785.
The $1,785 level is showing to be a harmonic alignment. I am interested in seeing what the price does when it comes down to that level. Looking at the weekly signal on gold, a close below $1,808 is going to activate a short trigger. The close is very important; it defines the momentum of the market on a 15 min basis which is what we track. We use the 15 min close to identify the trigger points or targets.
(Click on image to enlarge)
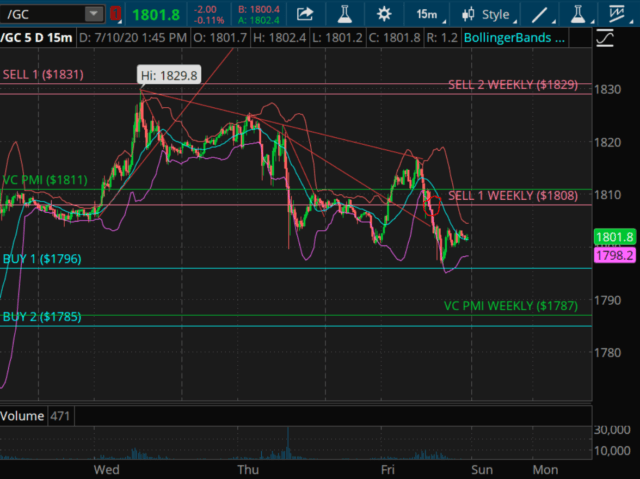
Courtesy: TD Ameritrade
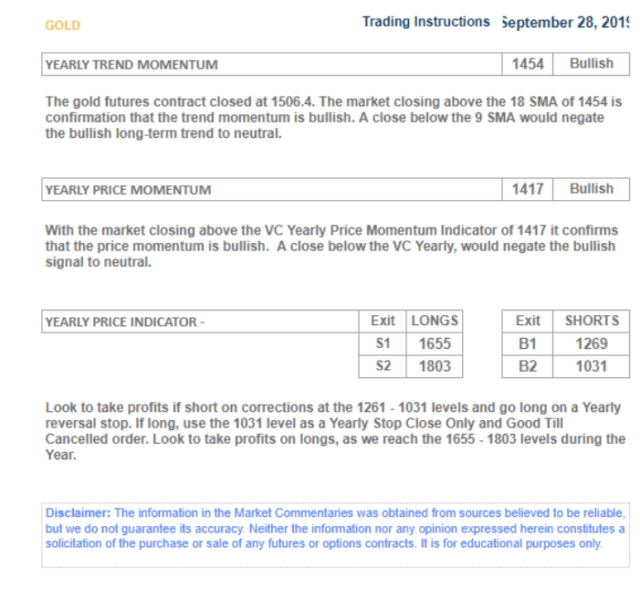
The market in gold in particular has accomplished some major targets. We published a report (Gold: Annual Target And S&D Prices For 2019/2020 Season) in Seeking Alpha on September 30th of last year, giving the annual targets of gold when the market was trading at about $1,506. In this report, the average was $1,454 and the market was bullish because it was trading above it. The average yearly price was $1,417. Because the market traded above that average price, we came in at a bullish annual yearly price momentum. When the algorithm identifies the average price, whether it be daily, weekly, monthly or yearly, it basically identifies the equilibrium of price for that period. Once we can identify the average price, then we can extrapolate the extreme levels above or below. Once we are able to extrapolate those values, then we can begin to use the artificial intelligence of the algorithm that once the average price is identified, it gives you the targets expected above or below that average price. In this case, the initial target coming into this period which was September 28th 2019-September 28th 2020, it gave you a target of $1,655 as a Sell 1 level and $1,803 as a Sell 2 level. It told us clearly to look to take profits at longs, as we reach $1,655-1,803. It gave us a pretty precise target that we use as a GPS to manage our trades. The low was in July 2019 at $1,435.50; most recently was March 16th when we came down to a low of $1,454. This was the collapse which was a consequence of the coronavirus pandemic.
(Click on image to enlarge)
What we have seen here is the change in the paradigm of gold from a commodity to a currency. This is when the Fed Treasury, central bank began to implement substantial amounts of stimulus to alleviate the panic set in by the collapse of the financial markets. During this correction, the financial markets lost more than $28 trillion in value. What you see here is the historical transformation that took place when the price of gold reverted right back and became a currency against the potential implosion of the valuation of the USD as a result of the incredible amount of stimulus that was coming into the market; this is not supportive of the USD.
(Click on image to enlarge)
I would like to make a point that whenever the Federal Reserve/Central Bank prints money, it represents a devaluation of the currency indirectly. It destroys the purchasing power of the currency that is issuing the debt. It is something that most people wouldn't realise and wouldn't be aware that the opposite side of the USD reserve currency is gold. In 1971, Nixon lifted the gold standard from the USD, eliminating the intrinsic backing to the currency, replacing it with a US petrodollar. This was the beginning of the collapse of the USD since the USD has declined more than 98% in purchasing power. The price of gold went from $35 prior to the Nixon era to a high of $1,900 as of 2011. The price of gold is an asset that in times of economic chaos, political turmoil or geopolitical uncertainty creates a safe haven or risk asset that you can buy to protect the intrinsic value of your fiat currency.
The incredible amount of stimulus that the government decided to implement in the marketplace is highly inflationary. Although we don't see inflation right away, the effect begins to erode the purchasing power of its currency. Pretty soon nominal values are not what they seem to be. We begin to see the hidden inflationary factors begin to take place. This was one of the fears that we had in the last Great Recession where we had the stimulus package that went into unlimited QE. The fears were that after the policy was implemented, we would see inflation unfold. We did not see inflation unfold because we did not see the money go to the main street and consumption. The money went into institutions and into corporations that essentially went to buying back their own stock. It elevated the values of their own stock and pretty much provided the fuel for the current highs that are in the stock market. That's another observation that we may need to look at some point in terms of the equity markets to main street. As we are experiencing some major issues with unemployment obviously, we had a massive collapse in the economy. The statistics are showing an unemployment rate of 11.2% that is still substantially higher than what it was a few months ago.
We will not be coming back to a normal economy. Things will not be normal. What's happening here is the old economy that was based on the fundamental structure that it was built on fiat currency burst the debt bubble to the point where they not only have to bring interest rates down to 0%, but they also will need to continue to print money because the system needs the USD particularly in a time of crisis when there is no other currency available to give you the same protection. It's almost like wearing the cleanest dirtiest shirt in the dirty laundry where we are with regards to the USD.
What the gold market has done is anticipate. As most markets do that, the fundamentals of the market have changed tremendously. In that sense, the USD is in jeopardy as a consequence of this unlimited amount of money that is being printed on a global scale. The European economy is another factor that is completely separate from the US economy, and they are following pretty much the same principles of printing as much money as the system requires. So on a global basis, we have opened the printing presses and have committed to printing as much money as the system requires. People are getting checks that shouldn't be getting checks, and companies are getting funded that should not be getting funded; this is free money. The question you really have to ask is who is going to pay for this bill?
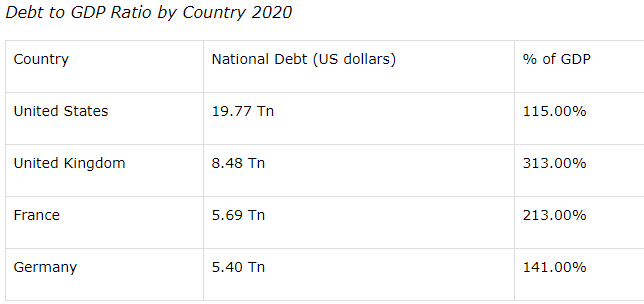
There are not that many choices at this point that the central banks or that the government leaders have in order to manage this incredible amount of global debt that currently seems to exceed 100% of GDP according to the latest data. These fundamental factors behind the price of gold have completely changed the psychology. They have changed the position of the gold market from a commodity to a currency to the extent that we are beginning to already see countries that are in need of USDs that do not carry the appropriate dollar reserves. They are using their gold assets as collateral to borrow money, to borrow fiat money.
(Click on image to enlarge)
Japan
Japan, with its population of 127,185,332, has the highest national debt in the world at 234.18% of its GDP, followed by Greece at 181.78%.
Global currency in relation to asset value
So we have entered what I believe is a new paradigm in terms of the gold market, as I have always believed gold to be a currency. For thousands of years, it has been proving that in times of chaos, particularly in fiat currency, the asset that will give you the intrinsic value protection so that the value of your assets will not erode as the fiat currency or the metrics are used in those assets, whatever currency it is priced in does not erode. Another example of assets priced in USD, even though you may be gaining equity value in terms of those asset prices in USD, as the inflation factor begins to devalue the intrinsic value of the USDs you are not really making as much money as you think when you factor in the currency exchange. So in order for you to get real value for your assets, you have to price the currency factor that it's in. That gives you the reality of where we are in relation to the global currency in a market relationship of values, particularly of global assets. So when assets begin to erode, it runs a very dangerous policy if you begin to print its currency. This is on the fears of if they don't make it available to the world, what will the financial community perceive from the US government. It has a lot to do with the psychology of stability on a global basis.
I believe that we are running into the danger, because of the coronavirus. Most other currencies are also experiencing the same challenges so they are also printing as much money as they need to control this pandemic. In the United States, it seems to be spiking to record levels. The numbers that are coming out right now in the United States are hard to accept. Being one of the most civilized countries in the world that is a major economic power, we are experiencing this pandemic crisis that is still out of control. It is affecting the psychology of people and the ability to come back to some kind of normality. Economically, personally, and financially. I'm taking a look at the gold market which I believe is offering tremendous opportunity if you seek the way where you can identify opportunity in times of crisis - incredible jewels amongst the chaos. I continue to look at gold as a tradable asset as well as a currency and all its assets underneath.
VC PMI Structure Completed Yearly Pattern
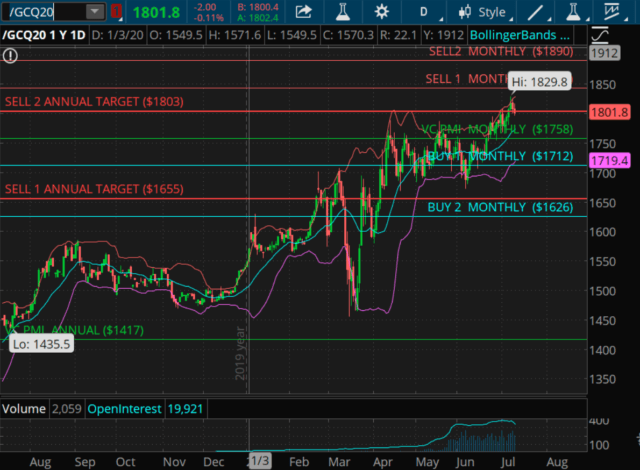
If we take a look at the gold market, the annual targets have been met with regards to the Variable Changing Price Momentum Indicator (VC PMI) A.I. that has completed the yearly pattern of $1,655-$1,803. When the patterns are completed, the system goes neutral. It tells you that you have completed the pattern from $1,655-1,803. The program is neutral, and the annual signal is neutral. When the price reaches these levels, it identifies a high probability area where the distribution of supplies can potentially be identified. Although there is not a guarantee that the prices do or will accomplish these levels, these are prospectively anticipated by the VC PMI. When they do, they complete the pattern and the market goes neutral. If the price closes below $1,803, it will activate an annual short trigger on a close below $1,803.
It's also telling you the price has reached the extreme level above the annual average of $1,417, so it has entered a high probability area of what is called Long Term Resistance. The A.I. tells you don't want to buy now at these levels; you don't want to buy against those probabilities. Even though the market still has room to go up to test the monthly target, it is an area that has a high probability that we are going to see sellers and supply to show up. The A.I. tells you to wait and see what the supply and demand do. Let the supply and demand exchange unfold and the price will identify whether there are more sellers than buyers, and that will by the price reflecting it coming down and closing bellow $1,803, and that activates the algorithm on the annual triggers. The initial target is the annual Sell 1 level of $1,655. Upon completion of this correction, we should challenge the 2011 highs of $1,900 per oz into the fall of 2020.
Disclosure: I am/we are long DUST.
To learn more about how the VC PMI works and receive weekly reports on the E-mini, gold and silver, check us out on more


