
Gold: Time To Load Up The Truck Again - Sunday, June 7
Fundamentals
We've had some surprising reports coming in that are related to unemployment, which was up 2.5 million jobs. The Street was looking for a loss of 7.5 million jobs. It caught the market by surprise. Economists were shocked as unemployment declined to 13.3%.
The recovery of unemployment was faster than expected, which is very positive for the economy and is decreasing the risk of a global depression. The surprising shift from jobs lost to jobs added potentially shows that this demand that was eliminated could come back into the economy with a vengeance.
The government’s stimulus has been at historic levels, which saved the markets. The debt levels are now completely out of whack. Although it was deflationary, this contraction decreased values way down, but the turnaround could be faster than anticipated. If we get demand back into the economy faster than expected, it could lead to shortages, inflation, and it could force interest higher. The world is going to have to pay for the disruption caused by COVID-19.
The economy collapsed in March, but has since recovered. The E-mini is now challenging the highs we made before the collapse. There are no benchmarks, given the historic size of the collapse and the speed of the recovery in stocks. These are amazing times for anyone looking at the markets as an opportunity.
Gold
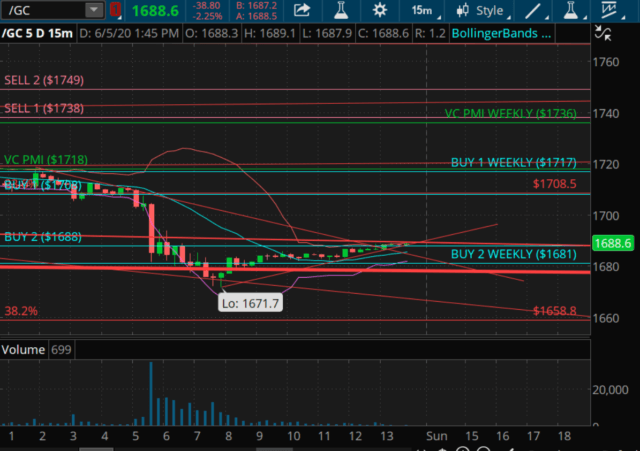
Courtesy: TDAmeritrade
In gold, we have been recommending to hedge up here into that $1,740 area. As we came into the weekly Variable Changing Price Momentum Indicator (VC PMI) Buy 1 and 2 levels, the market has been aligning itself with the daily and weekly numbers. We have come down to the Buy 2 daily level of $1,688, and the weekly Buy 2 level of $1,681. $1,682 is the last.
We are getting a weekly signal activated at $1,681. The Artificial Intelligence prepared us for the market moving into the upper zone of $1,740, which was an area of distribution. Ever since the market made the high of $1,788, we have been in a consolidation period. From the April 13 high of $1,788 to now, we are at the extreme below that mean.
The average daily price, as of June 5, is $1,718. The Sell 1 was $1,737, while $1,748 was the Sell 2 level. The Buy 1 is $1,707 to Buy 2 of $1,688 for June 7.
By coming down to the daily extreme level below the mean, it connects the daily Buy 2 number of $1,688 with the weekly number of $1,681. We have been expecting this reversion to the mean because that is what we trade. The VC PMI provides a specific structure of the mean and two extreme levels above (Sell 1 and 2), and two extreme levels below (Buy 1 and 2) the mean.
The daily average is $1,718 today. The Buy 1 is $1,708, which has a 90% probability of the market reverting from there back to the mean. Buy 2 is a two-to-one relative implied volatility and a 95% probability that the market will find buyers and will revert back to the mean. The price has come down below the daily and weekly average prices, $1,736 for the weekly. The daily and the weekly numbers now match, especially at Buy 2. Therefore, there is an extremely high probability that buyers will come into the market.
We use the 15-minute bar to trade and identify those buyers. The artificial intelligence, written in C++, tells the robot that the first time the market comes down to $1,681, it then goes neutral. It tells you, on the next bar, if it closes above, it’s a buy signal. If it closes below, it’s a short signal. That’s the logic of the algorithm. It keeps on trading. It identifies the trigger points. Here, we reverse engineer the system by showing how we use the automated VC PMI to identify the trigger points. It is not 100% guaranteed.
The first bar is a trend alert from neutral. It is not an actual trigger. We’ve come down to $1,681, which is a Buy level. If we are going to see buyers show up, it will be from this level. The VC PMI identifies the target from each level. When the daily and weekly numbers match or nearly match, then it is even more likely that buyers are going to come into the market. There’s a daily 90% and weekly 95% probability that the market will revert back from these levels in the $1,680's. We expect this level to hold; probabilities favor that it will hold.
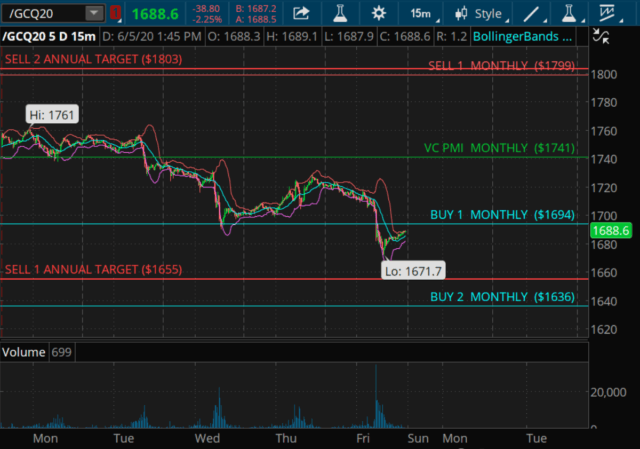
The monthly Buy 1 level is $1,694 to the Buy 2 of $1,636. Gold is into the monthly level of $1,694, with the potential of coming down to $1,636. When we look at the daily and weekly numbers, we are into a harmonic alignment on the daily of $1,688 and the weekly of $1,681. So, this harmonic alignment makes for a very strong signal.
Gold’s volatility is high. We are getting $40 and $50 moves in gold at least a couple of times a week. For futures traders, this volatility is a dream come true. The economic indicators provide a fundamental reason for why gold came down to these levels today. We have been looking at these levels mathematically for weeks, regardless of the fundamentals.
We are looking at probabilities. The lower the market goes from here, the greater the likelihood that buyers will come in, shifting the energy from selling to buying. Selling pressure has been greater, but buyers appear likely to start to come into the market in gold. You want to trade the market when it is at an extreme above or below the mean, which is when the market is most likely to revert to the mean.
Bears are going to be saying that the gold market is over. Gold is far from being over. This is a counter-trend opportunity. This correction could be a great opportunity to get into gold or to add to your positions before a long-term rise in gold prices. We could see a seasonal low, which generally occurs in the middle to the end of June. The tricky part is to identify where the top or bottom is going to be, and the VC PMI helps you see where that top or bottom is likely to be.
The VC PMI monthly signals said it could come down to $1,636. We recommended to cover the Direxion Daily Gold Miners Index Bear 3x Shares ETF (DUST) on this correction, and start to look at the VanEck Vectors Gold Miners ETF (GDX) and some of the long derivatives that appear to be in the same level of support.
We use the Direxion Daily Junior Gold Miners Index Bull 3x Shares ETF (JNUG) to trade the long side of the market. The Direxion Daily Gold Miners Index Bull 3x Shares ETF (NUGT) is a triple X velocity ETF. The GDX is a gold mining index.
The final targets to the upside in gold have not been completed, and we are still looking for the $1,800 level to be completed in the next few months. Gold has come down to an extreme level below the mean and is aligning the daily, weekly, and monthly levels, indicating that the price has entered a high probability level that these levels are going to hold as the completion of this counter-trend from $1,736.
The recommendation that we made in May, to sell in May and go away, has been completed. Now, we are suggesting you take long positions to cover any short positions you have, and to trade the market from the long side.
Disclosure:
I am/we are long GDX.
I wrote this article myself, and it expresses my own opinions. I am not receiving compensation for it. I have no ...
more

