
Gold: The Rainy Season Is Coming
Exact weather is hard to predict, even with forecasts, but we can look for clouds on the horizon to prepare ahead of time.
During the dry season, people near the equator feel like the sun is getting closer each day, making the heat unbearable at some point. The weather needs to periodically correct itself, allowing for some torrential downpours – this way life can survive. The same happens on the market; we can’t try to reach the sun by rallying incessantly. Patience is key. One thing is certain – a major storm front is moving closer, taking into account how the PMs behave.
Gold just moved higher once again, but mining stocks refused to follow. This is one of the most reliable indications that a top is being formed.
Before moving to the precious metals sector, let’s take a look at the USD Index.
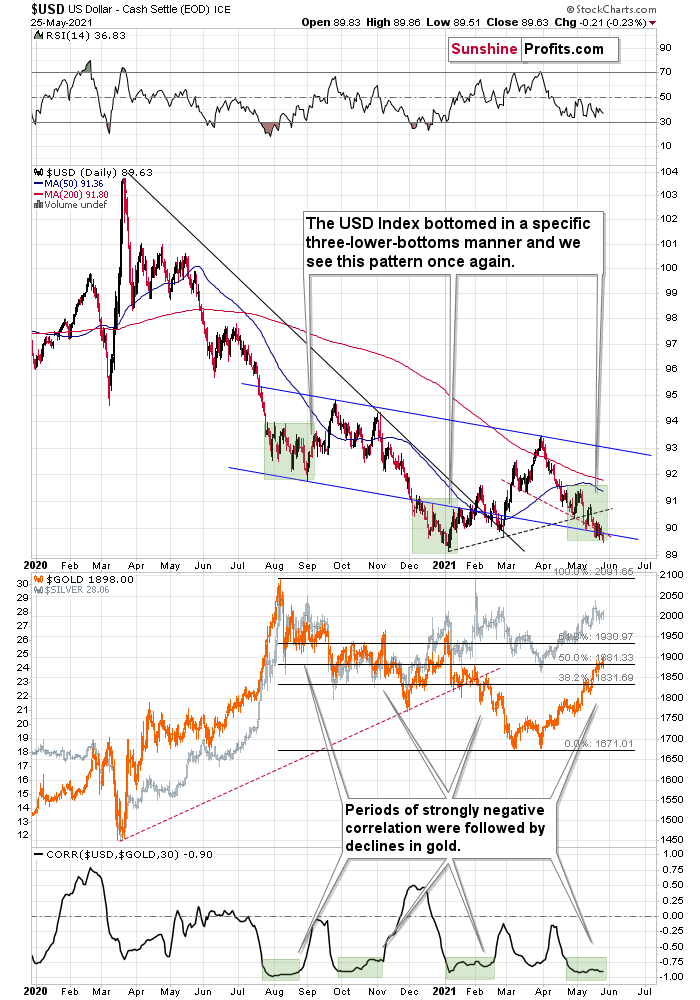
When I described the above chart yesterday (May 25), I wrote that the USD Index had been trading at about 89.6. Since this is the level at which the USD Index closed the day (approximately), practically everything that I wrote about its chart remains up-to-date:
This week’s move lower is a continuation, and most likely the final part, of a specific multi-bottom pattern that the USD Index exhibited recently.
I marked those situations with green. The thing is that the U.S. currency first declined practically without any corrections, but at some point it started to move back and forth while making new lows. The third distinctive bottom was the final one. Interestingly, the continuous decline took place for about a month, and the back-and-forth declines took another month (approximately). In July 2020, the USDX fell like a rock, and in August it moved back and forth while still declining. In November 2020, the USDX fell like a rock (there was one exception), and in December it moved back and forth while still declining.
Ever since the final days of March, we’ve seen the same thing all over again. The USD Index fell like a rock in April, and in May we’ve seen back-and-forth movement with lower lows and lower highs.
What we see right now is the third of the distinctive lows that previously marked the end of the declines.
And what did gold do when the USD Index rallied then?
In August, gold topped without waiting for USD’s final bottom – which is natural, given how extremely overbought it was in the short term.
In early January, gold topped (which was much more similar to the current situation given the preceding price action) when the USDX formed its third, final distinctive bottom.
The USD Index is after a two-month decline, half of which was the back-and-forth kind of decline. It’s forming the third – and likely the final – bottom, and gold just refused to react positively to this situation in today’s pre-market trading.
This might be “it” – the markets might be forming their final reversals here, starting to follow the most bearish (in the case of gold) part of the analogy to the price action in 2008 and 2012.
The Repeating Pattern
Gold has now moved higher, and it even moved slightly above $1,900 in today’s pre-market trading, which seems positive. But it doesn’t change anything with regard to gold’s analogies to how it performed in 2008 and 2012 right before the slide.
Gold seems to be insisting on repeating – to some extent – its 2012 performance, and – to some extent – its 2008 performance. Either way, it seems that gold is about to slide.
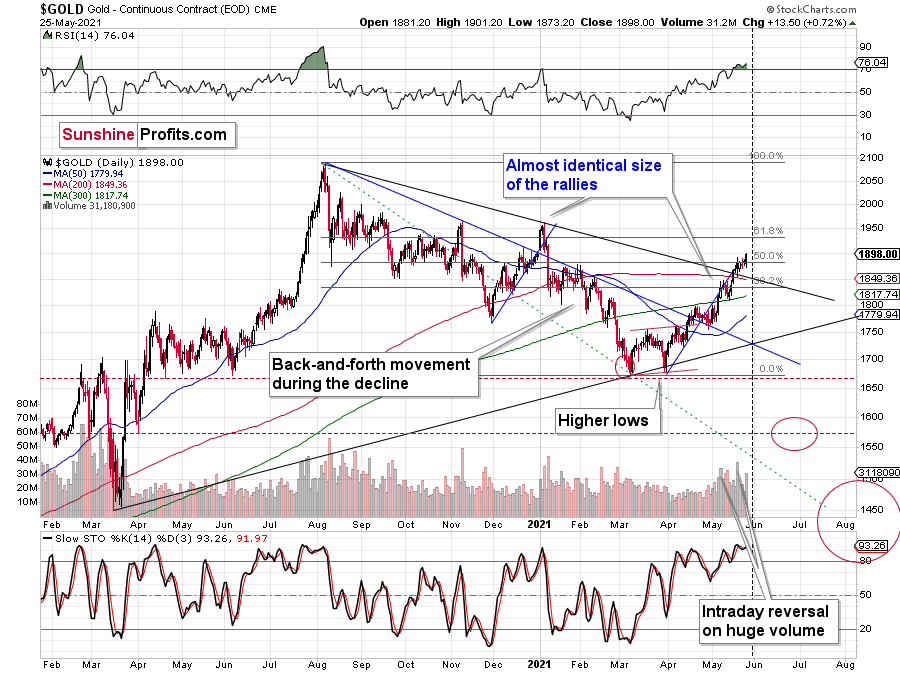
The initial reversal in gold took place after gold moved very close to its mid-January highs and the 50% Fibonacci retracement based on the August 2020 – March 2021 decline. Yesterday’s close was the first close above this important resistance, so the breakout was not confirmed.
The sizes of the current rally (taking the second March bottom as the starting point) and the rally that ended at the beginning of this year are practically identical at the moment. The current move is only a little bigger.
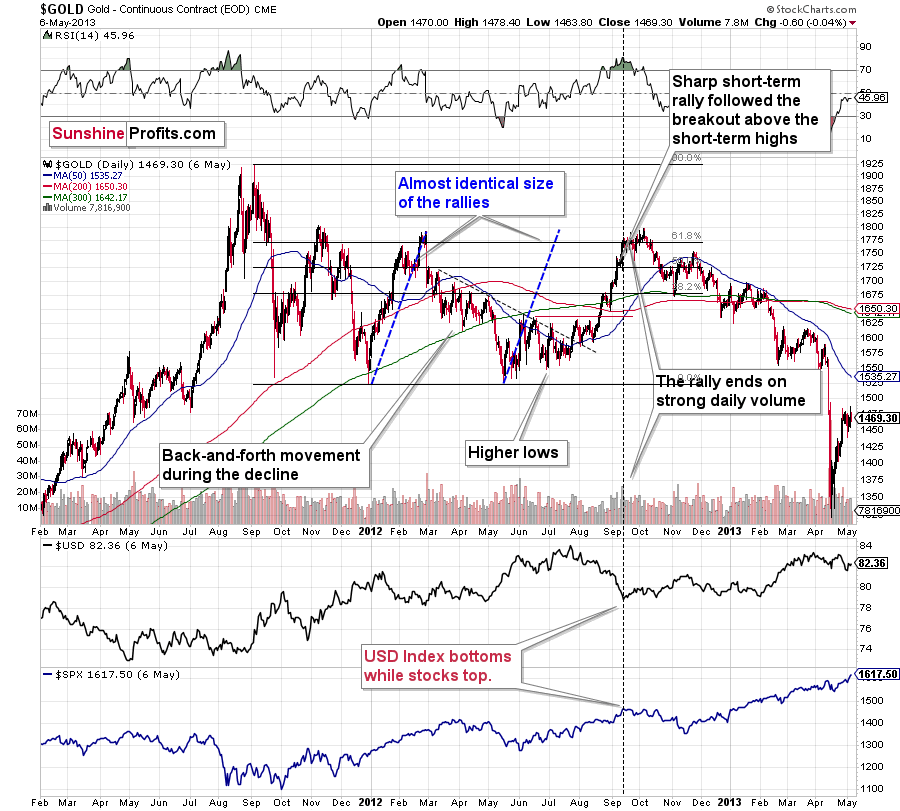
Just as the rallies from early 2012 and late 2012 (marked with blue) were almost identical, the same could happen now.
The March 2021 low formed well below the previous low, but as far as other things are concerned, the current situation is similar to what happened in 2012.
The relatively broad bottom with higher lows is what preceded both final short-term rallies – the current one, and the 2012 one. Their shape as well as the shape of the decline that preceded these broad bottoms is very similar. In both cases, the preceding decline had some back-and-forth trading in its middle, and the final rally picked up pace after breaking above the initial short-term high.
Interestingly, the 2012 rally ended on huge volume, which is exactly what we saw also on May 19 this year. Consequently, forecasting much higher gold prices here doesn’t seem to be justified based on the historical analogies.
The thing I would like to emphasize here is that gold didn’t form the final top at the huge-volume reversal on Sep. 13, 2012. It moved back and forth for a while and moved a bit above that high-volume top, and only then the final top took place (in early October 2012).
The same happened in September and in October 2008. Gold reversed on huge volume in mid-September, and it was approximately the end of the rally. The final top, however, formed after some back-and-forth trading and a move slightly above the previous high.
Consequently, the fact that gold moved a bit above its own high-volume reversal (May 19, 2021) is not an invalidation of the analogy, but rather its continuation.
There’s one more thing I would like to add, and it’s that back in 2012, gold corrected to approximately the 61.8% Fibonacci retracement level – furthermore, the same happened in 2008 as you can see in the below chart. Consequently, the fact that gold moved above its 50% Fibonacci retracement doesn’t break the analogy either. And even if gold moves to $1,940 or so, it will not break it. It’s not likely that it is going to move that high, as in both cases –in 2008 and 2012 – gold moved only somewhat above its high-volume reversal before forming the final top. So, as this year’s huge-volume reversal took place close to the 50% retracement and not the 61.8% retracement, it seems that we’ll likely see a temporary move above it, which will create the final top. And that’s exactly what we see happening so far this week.
The lower part of the above chart shows how the USD Index and the general stock market performed when gold ended its late-2012 rally and was starting its epic decline. In short, that was when the USD Index bottomed, and when the general stock market topped.

Back in 2008, gold corrected to 61.8% Fibonacci retracement, but it stopped rallying approximately when the USD Index started to rally, and the general stock market accelerated its decline. This time the rally was not as volatile, so the lower – 50% Fibonacci retracement level will hold the rally in check.
Taking into consideration that the general stock market has probably just topped, and the USD Index is about to rally, then gold is likely to slide for the final time in the following weeks/months. Both above-mentioned markets support this bearish scenario and so do the self-similar patterns in terms of gold price itself.
While gold moved to new highs, the GDX ETF didn’t (and neither did silver).
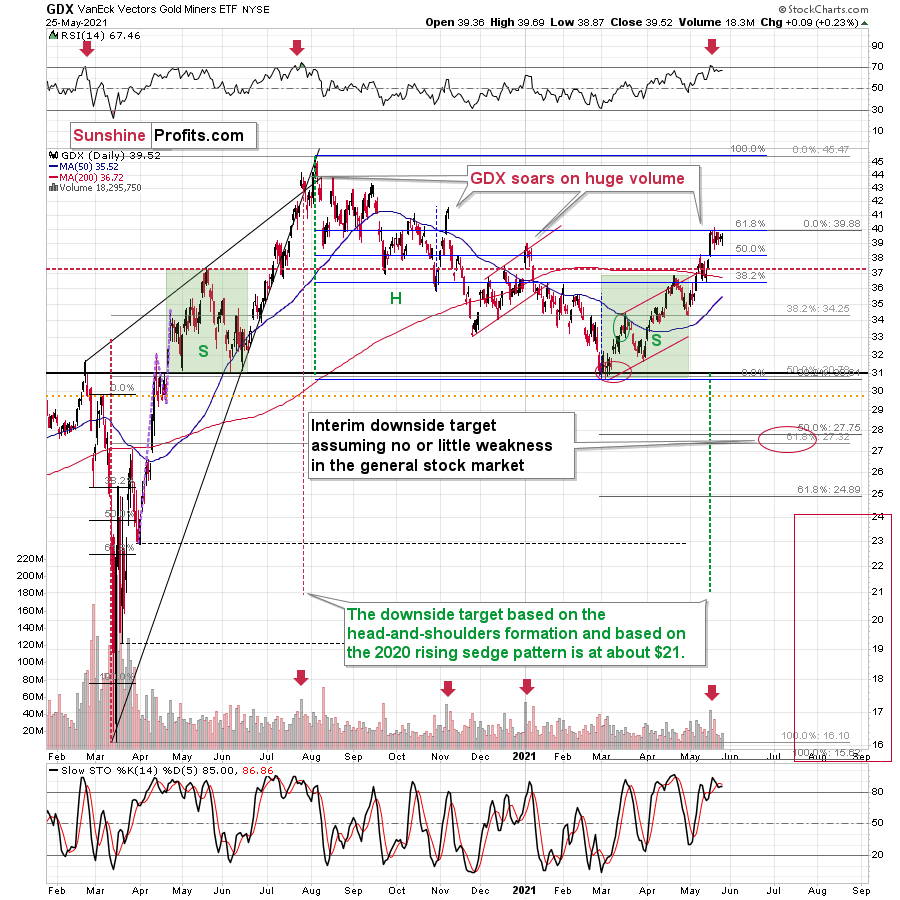
It moved mere nine cents higher and this move took place on relatively low volume – making that a bearish indication, not a bullish one.
Disclaimer: All essays, research and information found on the Website represent the analyses and opinions of Mr. Radomski and Sunshine Profits' associates only. As such, it may prove wrong ...
more


don't you think spike can reach $1952 spot price before sellers wake up?Frankly speaking I am loaded with long term longs and I am fine with any scenarios. a rise of 2100 or a fall of 1480
oddly enough
I read your articles with interest, especially the graphs are good. I would like to ask you what price of gold would make you capitulate in the forecast?this is important and should be stated every time as clearly as you stated the drop targets. Sorry for the platitudes. Best wishes