Gold, S&P 500 Firm Despite Consumer Sentiment Report Miss
Markets are trading fairly flat following the New York opening bell and latest release of monthly consumer sentiment data. The headline consumer sentiment figure came in at 76.2 according to the DailyFX Economic Calendar. This compares to the market forecast of 80.9 and prior reading of 79.0. The worse-than-expected consumer sentiment report is largely due to declines concentrated in future expectations and among households with less than $75,000 in income.
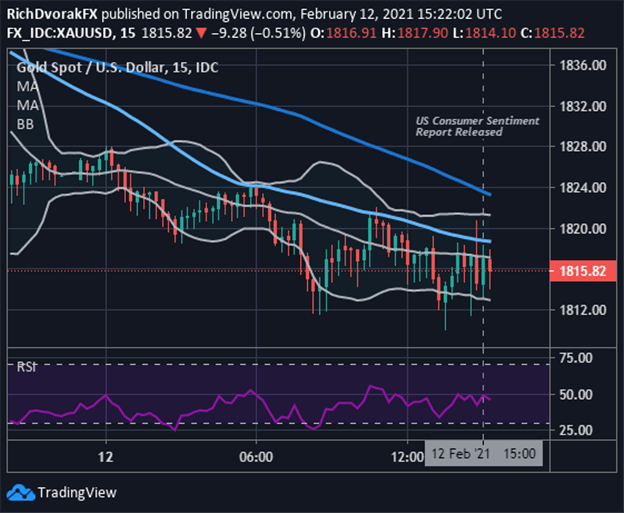
Gold price action may some buoyancy in response to the sentiment report release, which showed one-year inflation expectations jump to the highest level since July 2014 at 3.3%. The US Dollar came under pressure across the board of major currency pairs right after the disappointing sentiment report crossed market wires and could help gold aim higher.
GOLD PRICE CHART: 15-MINUTE TIME FRAME (11 FEB TO 12 FEB 2021)

Chart by @RichDvorakFX created using TradingView
The precious metal still hovers near intraday lows, however, near the $1,815-price level. Breaching this zone of support could bring month-to-date lows back into focus. Though bullish divergence hinted at by the relative strength index likely stands out as a positive technical development. The 20-day simple moving average might serve as a potential resistance level.
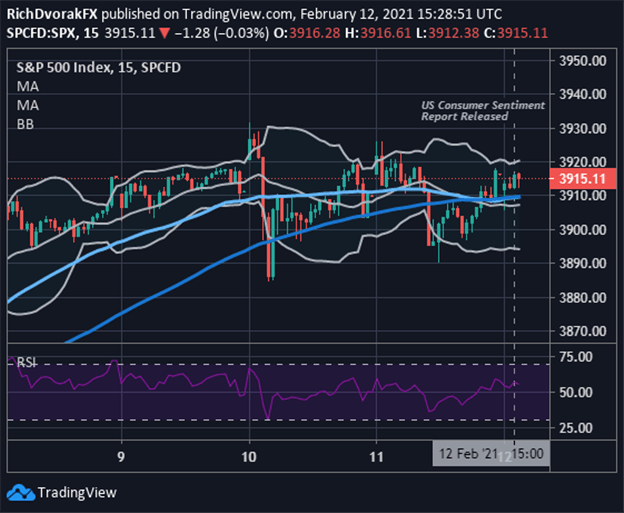
S&P 500 INDEX PRICE CHART: 15-MINUTE TIME FRAME (08 FEB TO 12 FEB 2021)

Chart by @RichDvorakFX created using TradingView
S&P 500 Index remains little changed with stocks consolidating off record highs. This seems to have formed a short-term wedge chart pattern underpinned by lower highs and higher lows notched so far this week. The broader direction of major stock indices such as the S&P 500 likely hinges on how much runway is left in the reflation trade. Though there may be episodes of risk aversion sparked by disappointing data, weaker economic data stands to be met with more forceful action from fiscal and monetary stimulus.
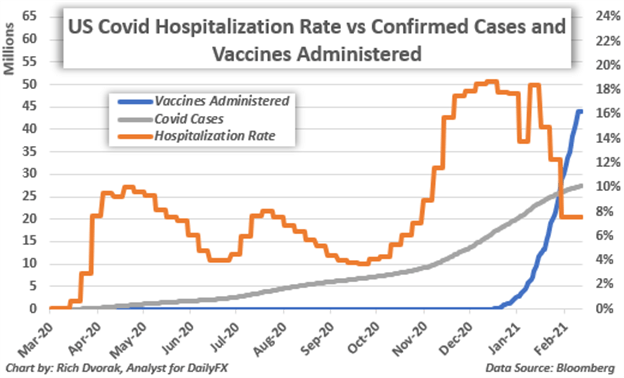
CHART OF US CONFIRMED COVID CASES, VACCINES ADMINISTERED & HOSPITALIZATION RATE

That all said, it is likely consumers and markets stay broadly upbeat in light of recent covid vaccine developments. The swift vaccine rollout across the United States over the last few weeks has propelled the number of vaccines administered to nearly 45-million doses and counting. Meanwhile, the covid hospitalization rate has plunged to 7.6% from a high of 18.4% earlier this year. Congress making progress toward finalizing the $1.9-trillion fiscal aid package proposed by President Biden, in addition to flush liquidity provided by the Federal Reserve, likely pose positive tailwinds to both asset prices and consumer sentiment as well.
Disclosure: See the full disclosure for DailyFX here.


