
Gold, Silver, Miners: The Zenith And Its Shadows
Most likely we saw the precious metals reach their zenith on May 19, like the tropical sun on the day of the equinox. What will come afterward?
Usually, when we think about the zenith, we have in mind a natural phenomenon caused by the tropical sun being exactly over our heads. But the zenith can also mean that something reached its peak – and just as the sun starts casting increasingly longer shadows after retreating from the highest point in the sky, the same happens when an asset on the market starts backing out after topping.
Its shadow – i.e., its ramifications – is cast in one particular direction, and it usually goes this way until the sunsets. Therefore, just as the shadows are getting longer, and longer, and longer, the drop after the top could go lower, and lower, and lower…
During yesterday’s (May 20) session, we saw more or less the repeat of the previous day’s indications – gold stocks reversed once again, and gold is trading where it was trading two days ago. Silver is already trading lower. Consequently, much of my previous comments remain up-to-date.
On Wednesday, gold miners reversed in a classically bearish way, and yesterday’s low-volume session (also a reversal) looks like Wednesday’s reversal’s shadow.
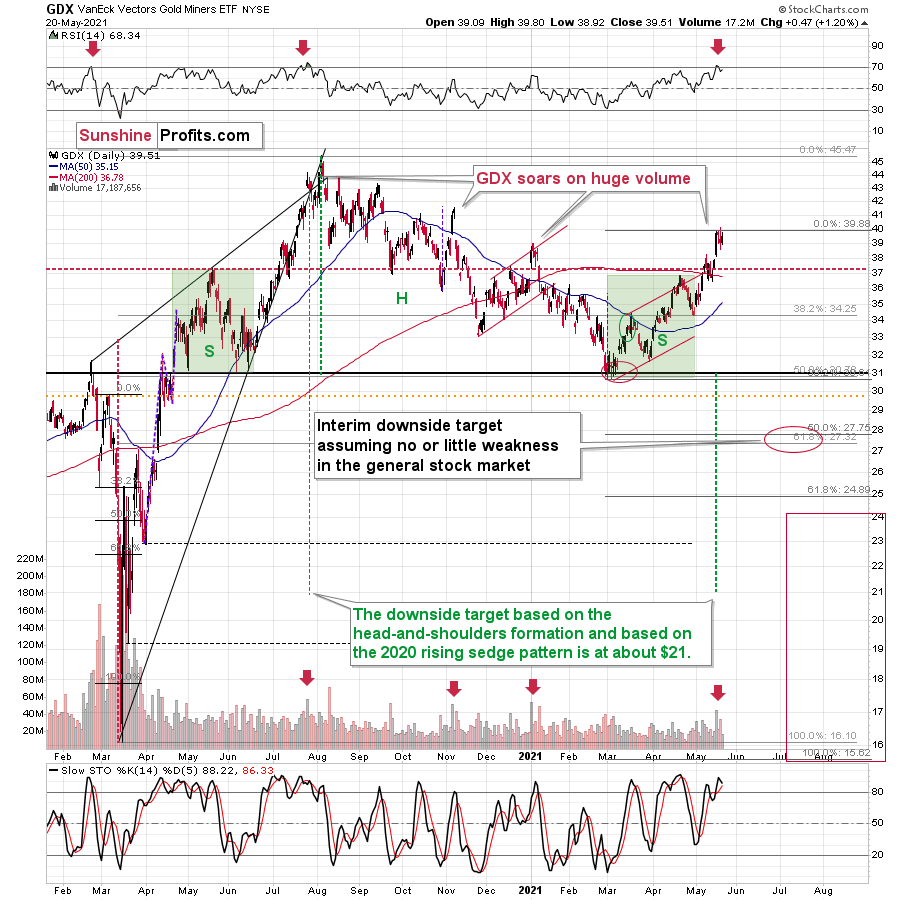
The GDX ETF first tried to rally to new highs, then it failed to hold them. Wednesday’s reversal took place on big volume (important bearish confirmation), and the “shadow reversal” took place on relatively low volume. The low volume doesn’t confirm the reversal, but it more or less invalidates the seemingly bullish fact that miners closed yesterday’s session higher.
Moreover, please note that the volume was similarly low to what we saw on January 7, 2021, when the 4-day top was ending. Yesterday was the fourth day of what appears to be a broad top.
Let’s also keep in mind that the RSI indicator just moved back below 70 after being above it. This happens rarely, and when it happened previously (in the past 1.5 years), it meant that a huge price decline was about to follow.
Silver reversed in a different manner.
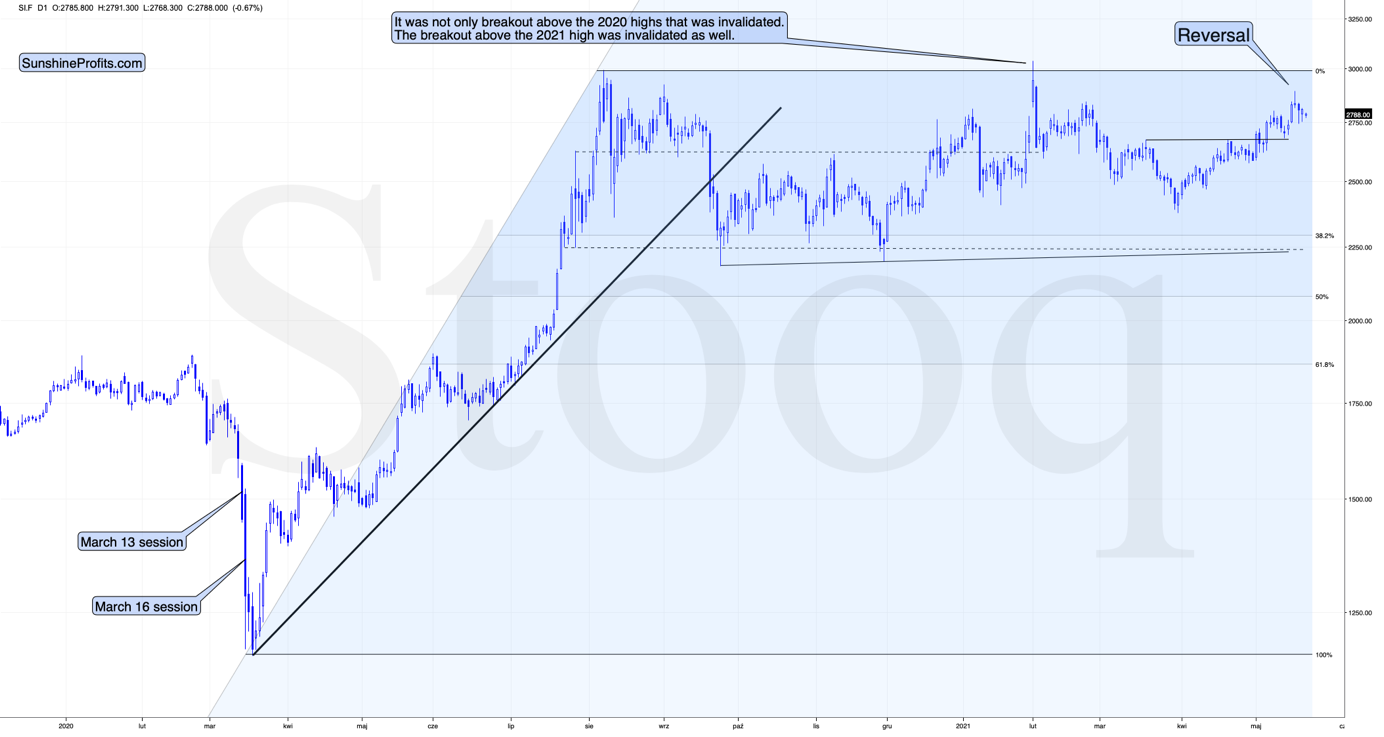
The white metal didn’t move to new highs yesterday. Conversely, it moved lower, and then it only recovered intraday decline without moving visibly higher (silver futures ended the day only $0.04 higher). The true reversal happened on Tuesday – and what we saw yesterday and on Wednesday was just its consequence. It’s quite often the case that the tops and bottoms in the precious metals market take place more or less (!) simultaneously, but not necessarily exactly on the same day. Consequently, what we saw this week is quite normal.
Gold didn’t manage to move to new intraday highs yesterday – however, it didn’t decline visibly either.
It moved a bit lower in today’s pre-market trading, and overall, it’s just $8 higher than it was at the end of Tuesday’s session. This might seem positive given that gold managed to move slightly above its declining medium-term resistance lines. However, given what’s happening in the mining stocks and all the signals from them, I doubt this breakout will really hold.
Here’s another reason: the Fed is attempting to control the long-term rates, and we just saw a short-term exodus from the cryptocurrency market. Theoretically, capital should be flowing into gold as a safe-haven / inflation-hedge asset, and it should be soaring. But it’s not. It did move higher recently, but compared to what “should have” happened given the importance of the above-mentioned developments, the reaction is barely noticeable.
Instead, gold seems to be insisting on repeating – to some extent – its 2012 performance, and – to some extent – its 2008 performance. Either way, it seems that gold is about to slide.
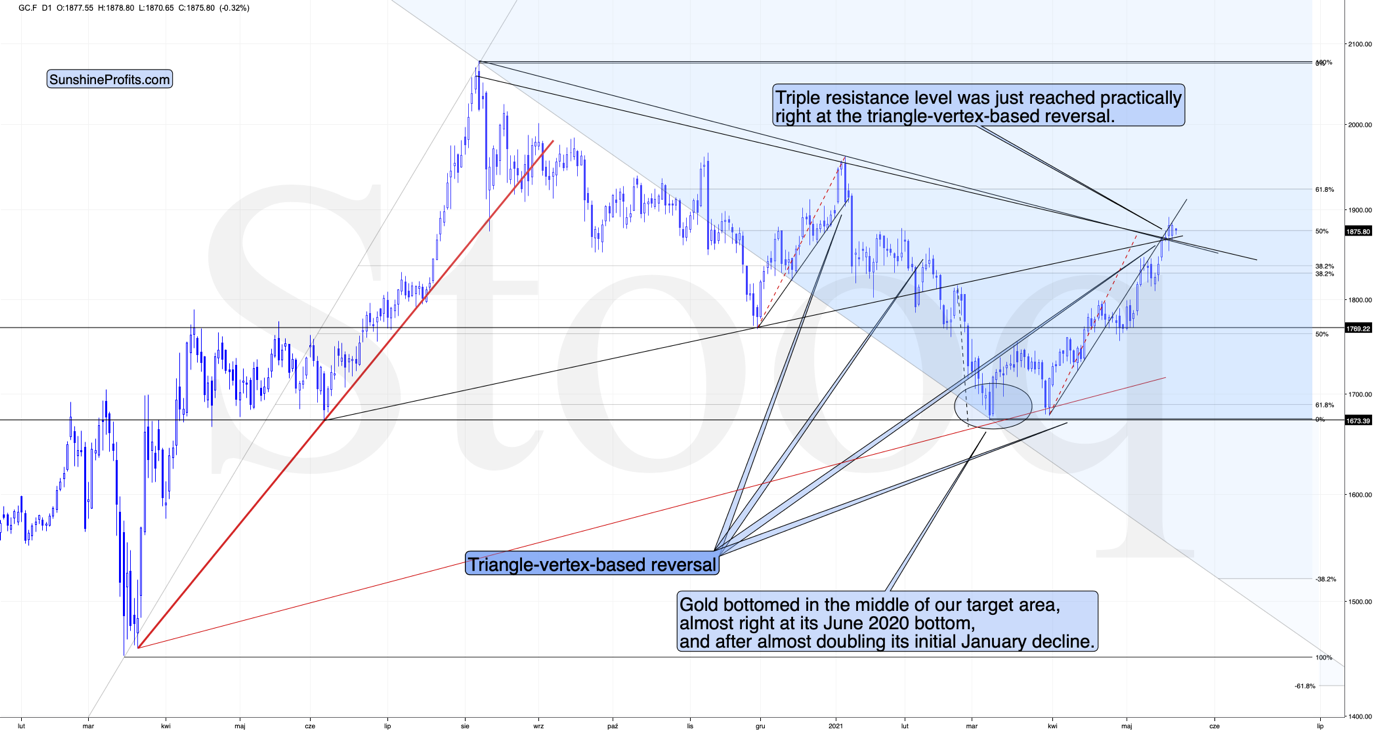
The reversal in gold took place after gold moved very close to its mid-January highs and the 50% Fibonacci retracement based on the August 2020 – March 2021 decline.
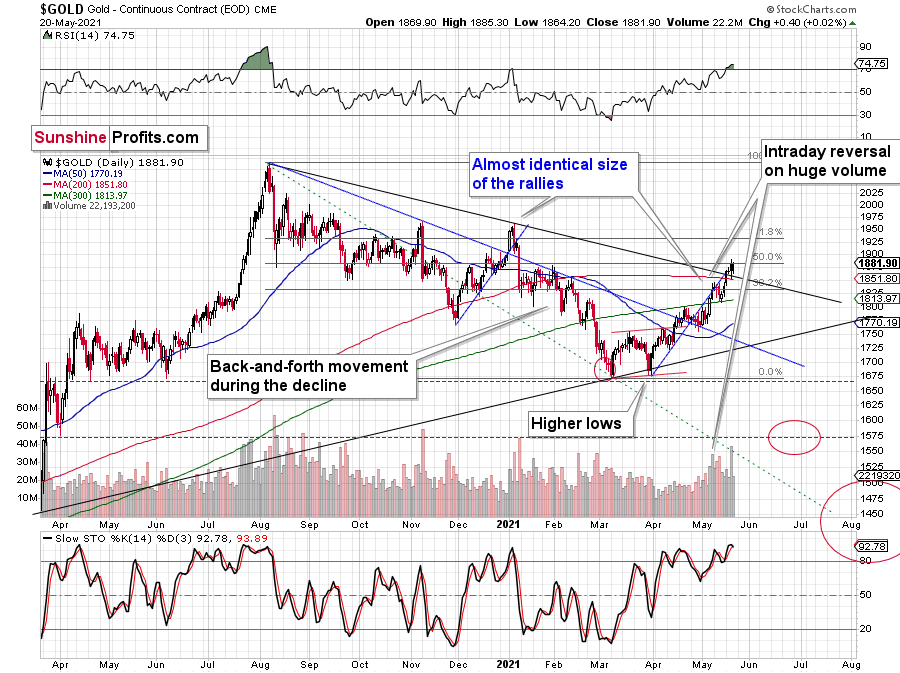
The sizes of the current rally (taking the second March bottom as the starting point) and the rally that ended at the beginning of this year are practically identical at the moment.
Just as the rallies from early 2012 and late 2012 (marked with blue) were almost identical, the same could happen now.
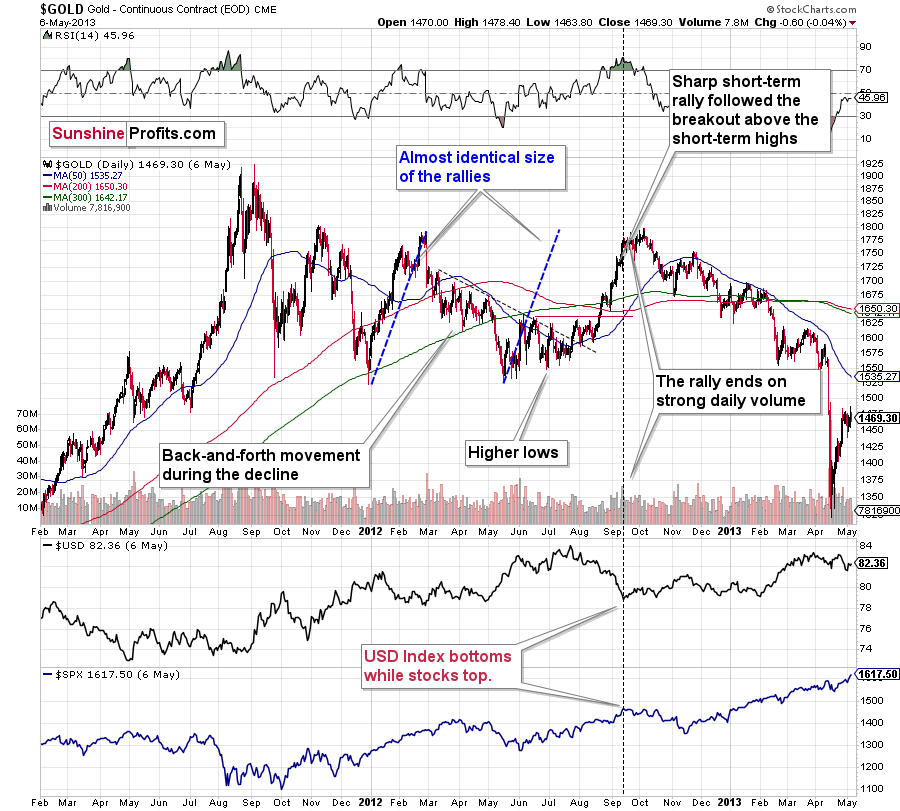
The March 2021 low formed well below the previous low, but as far as other things are concerned, the current situation is similar to what happened in 2012.
The relatively broad bottom with higher lows is what preceded both final short-term rallies – the current one, and the 2012 one. Their shape as well as the shape of the decline that preceded these broad bottoms is very similar. In both cases, the preceding decline had some back-and-forth trading in its middle, and the final rally picked up pace after breaking above the initial short-term high.
Interestingly, the 2012 rally ended in huge volume, which is exactly what we saw also on May 19 this year.
What is even more interesting is that back in 2013 gold started its gargantuan (…) slide from about $1,800 and it is not far (from the long-term point of view) from this level also today.
Moreover, let’s keep in mind that the RSI indicator just topped slightly above 70, which is what tends to happen when gold tops. The upside seems very limited. In fact, it seems that the top in gold might already be in.
The lower part of the above chart shows how the USD Index and the general stock market performed when gold ended its late-2012 rally and was starting its epic decline. In short, that was when the USD Index bottomed, and when the general stock market topped.
Disclaimer: All essays, research and information found on the Website represent the analyses and opinions of Mr. Radomski and Sunshine Profits' associates only. As such, it may prove wrong ...
more


HI -Your new article is interesting but I will try a couple of remarks. you took a daily timeframe - for gold you need a weekly timeframe . I do not see any overbought on the rsi. I'm long on gold but willing to buy lower again.cash is no problem