
Gold Set To Reclaim 1900, Then 2000
That title ain't sayin' that much: but 'tis better than returning to the 1700s. And 'tis based on a technical quirk at which you might smirk, but with Gold having so far survived its underlying support zone (1854-1779) here goes:

Gold just recorded a weekly gain of +21 points (+1.1%) which incorporated both a "lower weekly low" and a "higher weekly high", (trader talk for an "outside week"). In this case, such price triumvirate (an up week and a "lower low" and "higher high") has occurred just 12 other times in the past six years. And from those occasions, (drum-roll please): Gold's average gain within the ensuing four weeks has been +45 points. Ho-hum, perhaps, but let's see where that can put price. Employing such average gain from Gold's weekly settle yesterday (Friday) at 1875, et voilà, there's your 1920 between now and, let's say, the Fourth of July, (just in case yer gettin' fired up at home).
In fact if you peer closely at the below chart of Gold's weekly bars from a year ago-to-date, the rightmost bar eclipsed the low and high of each of the two prior weeks. Moreover, it all happened within yesterday's low-to-high range alone from 1827-1880 as May's retail inflation "headline" number came in at an annualized rate of +10%. Blend that with the shrinking StateSide Gross Domestic Product, and Stagflation City is rockin' tonight:

As for Gold still being beneath the descending red dots of parabolic Short trend, should price pop atop 1900 as our opening analysis suggests, such trend ought in turn flip back to Long, allowing Gold to then challenge the RUS/UKR war spike that reached 2079 this past March 8, and ideally the All-Time High of 2089 (August7, 2020). 'Tis not that far from here.
Nothing like a move in the right direction, eh? Yet re-attaining the 1900s -- let alone those prior highs -- pales in comparison to Gold's present-day debasement valuation (per the opening Scoreboard) of 4024. That true valuation is well more than twice today's 1875 market price. Further by that yardstick, Gold is long overdue to double! To wit, let's count by days as follows:
■ from the final trading day of the second millennium (December 31, 2000 for those of you who know how to count) when Gold was 274, it took 1,260 trading days (5.0 trading years) to double to 546 (January 9, 2006);
■ following that came a further 962 trading days (3.8 trading years) for Gold to again double to 1096 (November 4, 2009);
■ but since then: Gold's highest trade has been 2089 (07 August 2020) meaning price has not yet re-doubled (from 1096 to 2192) even with this to-date passage of 3,173 trading days (12.6 trading years). However, the U.S. M2 money supply since that very same November 4, 2009 has increased toward threefold from $8.5 trillion to $21.7 trillion today. Gold's non-participation in tandem is apoplectically beyond absurdity!
And yet, the market (1875 today vs. 4024 valuation) is never wrong, albeit, more and more we read or hear of Gold's market price being stifled by the "M Word" crowd. Some analysts apparently have dug sufficiently into the COMEX time-and-sales data such as to ferret out mathematical proof of "M". (No, we don't like mentioning the "Word" itself).
But when entities of comparatively vast Gold holdings and/or sufficiently margined accounts engage in trading a market which is almost otherwise unowned, "M" can be put into play if so desired. Is one's Gold getting a bit high in price, perhaps such that one may have to make physical delivery? Heaven forbid! Just sell a few hundred contracts at-the-market such as to swiftly suppress price. Then slowly buy the position back one contract at a time so as not to move price back up. "It's so easy, a troglodyte can get it right!" Perhaps some did. Regardless, let's get Gold's price moving further up and to the right!
Meanwhile, here's something that's worked right with respect to the stock market. For those of you who track the website's S&P MoneyFlow page, its broader time frames (one month and one quarter) of late had been leading the Index such as to suggest a drop of some 300 points. For just recently the S&P had been careening 'round the 4200 level; yesterday it settled at 3900: "Uh-oh, it's magic"--[The Cars, '84]. Now the near-term MoneyFlow time frame (one week) senses we'll see the S&P strain for a bit of a bounce. However within the context of our musing a week ago that the S&P's "relief rally" had run its course, it seems apparent the anticipated run down to the 3600-3200 critical support zone has resumed.
'Course far more fundamentally, if this is The Run to get the S&P back to proper value as trued up with earnings -- especially in a rising interest rate environment -- then 3600-3200 obviously is peanuts. (But one support shelf at a time, right?)
Still, with Q2 Earnings Season commencing in some five weeks' time -- and given consideration of the Economic Barometer having declined right through Q2 to this point -- analysts' S&P calls for levels like 2900 are not out of the question as the traditional "summer rally" this time 'round looks anything but. Remember: our "live" S&P price/earnings ratio is at present 30.3x vs. its lifetime mean of 22.3x; should earnings not grow, that mathematically calls for a further S&P P/E means reversion from here (3900) of -26% to "Hello!" 2900. Or to the reprise the Prescient Commentary from 17 May: "...we see no sense fundamentally to be in the stock market..." Here's the Baro with the S&P 500 in red, the time frame being from one year ago-to-date:

Gruesome as 'tis, the Econ Baro "by consensus" looks to regain some ground in the ensuing week. But that is then, whereas this is now.
And in assessing "The Now", StateSide applications for obtaining a mortgage according to the de facto Mortgage Bankers Association source have just reached a 22-year low. Uh-oh; and 'tis reality, not magic. Right in line with stagflation time. (Note: someone might fax the World Bank that, rather than their warning of stagflation risk, 'tis already been recorded on a REAL basis in the U.S. for three consecutive quarters). Hardly any wonder, according to the National Opinion Research Center over there at The University of "Go Maroons!" Chicago that StateSiders are becoming quite disheartened over the state of the States both economically and politically. Indeed the University of "Go Blue!" Michigan Sentiment Survey for June just recorded its lowest reading (50.2) in our Econ Baro's 24-year history.
So to segue as does the FinTvMedia: "For reaction in the markets" (sheesh...) let's go to our five primary BEGOS components via their percentage tracks from one month (21 trading days) ago-to-date. Obviously Oil remains the huge winner; but amongst the other four more lowly performers, Gold appears as having the best grip. Yes, that's a stretch to say, but per our "outside week" assessment, Gold's about to get going.
"Barring the manipulators, mmb..."
Squire, rarely do you mince your words. Yes. Here are the tracks:

Specific to the precious metals, next we've their daily bars from three months ago-to-date for Gold on the left and for Silver on the right. Fairly identical looking panels, although Silver's "Baby Blues" of trend consistency have just taken an abrupt twist, the Gold/Silver ratio noted earlier as 85.5x which is well above its millennium-to-date mean of 66.8x. 'Tis key to bear in mind that Gold 1875 is at 90% of its All-Time High, whereas for 21.93 Silver today, she's priced at just 44% of her record high. Don't forget the Silver:

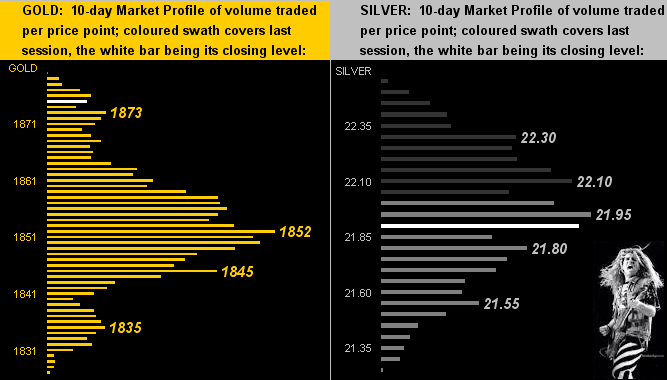
Drilling down into their 10-day Market Profiles for Gold (at left) and Silver (at right), 1852 becomes the yellow metal's key trading support. For the white metal, she's essentially at mid-Profile support/resistance right now. Cue Van Halen's Sammy Hagar from back in '92, "Right here and now ... Turn this thing around":
The Gold Stack
Gold's Value per Dollar Debasement, (from our opening "Scoreboard"): 4024
Gold’s All-Time Intra-Day High: 2089 (07 August 2020)
2022's High: 2079 (08 March)
Gold’s All-Time Closing High: 2075 (06 August 2020)
The Weekly Parabolic Price to flip Long: 1944
The Gateway to 2000: 1900+
10-Session directional range: up to 1880 (from 1827) = +53 points or +2.9%
Trading Resistance: nothing materially notable by the Profile
Gold Currently: 1875, (expected daily trading range ["EDTR"]: 25 points)
Underlying Structural Support Zone: 1854-1779
10-Session “volume-weighted” average price magnet: 1853
Trading Support: (notable Profile apices):1852 / 1845 / 1835
The 300-Day Moving Average: 1831 and rising
The Final Frontier: 1800-1900
The Northern Front: 1800-1750
2022's Low: 1779 (28 January)
On Maneuvers: 1750-1579
The Floor: 1579-1466
Le Sous-sol: Sub-1466
The Support Shelf: 1454-1434
Base Camp: 1377
The 1360s Double-Top: 1369 in Apr '18 preceded by 1362 in Sep '17
Neverland: The Whiny 1290s
The Box: 1280-1240
To close, ready to get more (or put out more) for your buck? This coming Wednesday (15 June) the Federal Open Market Committee shall vote to jack up the Bank's Funds Rate by another 50 basis points. Oh joy, oh boy, oh happy day! 'Course, conventional wisdom says that's bad for Gold. Just remember for the stint from 2004 into 2006 as the FedFunds Rate rose from 1.00% to 5.25%, the price of Gold increased 59%! We can thus get started with Gold 1900, then Gold 2000 and on toward our year's forecast for Gold 2254!

Cheers!
...m...
Disclaimer: If ever a contributor needed a disclaimer, it's me. Indeed, your very presence here has already bound you in the Past, Present and Future to this disclaimer and to your acknowledging ...
more

