
Gold - Sell In May And Go Away
The E-mini S&P 500 is at an area where it is likely to revert back up to the mean, while gold is reaching new highs, and we are in an area where a sell signal is likely.
We use the proprietary artificial intelligence of the Variable Changing Price Momentum Indicator (VC PMI) to analyze the markets and guide our trading, like a GPS system. The VC PMI is based on regression to the mean and a Fibonacci structure. The algorithm provides a structure based on the mean, either daily, weekly, monthly, or annually, and then two levels above (Sell 1 and 2) and two levels below (Buy 1 and 2).
The buy and sell levels are one standard deviation away from the mean, with 90% (Buy 1 or Sell 1) and 95% (Buy 2 and Sell 2) probabilities, and if the market reaches those levels, then it will revert back to the mean. Red on the chart represents an area of distribution of supply, or that sellers are likely to enter the market. Blue on the chart represents an area of distribution of demand, or that buyers are likely to enter the market. The same methodology applies to every market we analyze with the VC PMI.
Gold
Gold is making new daily highs at $1743.80, up $27.40. We have entered into the area of distribution of supply. We have met the target of $1728 on the daily signals, and $1739 is the daily Sell 2 level. We are also near the weekly level of $1739.
We are anticipating a potential cyclical top that seems to be coming in. It is a 30-day top from April 14 to now. We could see the completion of this pattern. This will activate a high probability that this level of resistance is going to be sustained.
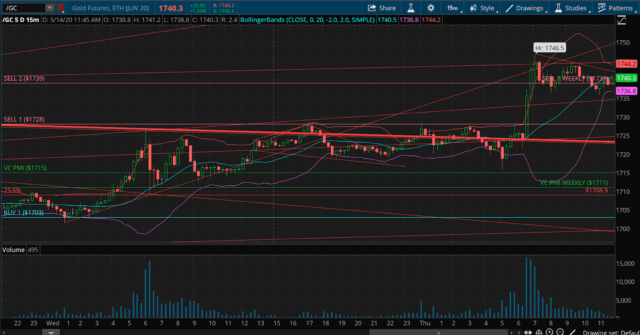
If the market trades above the daily Sell 2 level, then the level of resistance at 39 has been broken, and has become a support level. It also connects the algorithm to the weekly numbers right away. It has met the daily targets of Sell 1 and 2, and is meeting the weekly Sell 1 target of $1739.
We are taking profits on any long positions as we enter a red zone daily and weekly, which increases the probability that we will begin to see sellers come into the market. The market will begin to liquidate long positions. The price on the daily and weekly is overbought.
The same principles apply to the weekly signals in relation to the monthly signals. If the market goes above the Sell levels on the weekly, it then automatically triggers the monthly signals.
This was a spike move, which occurs when a cycle top appears. Some people consider this a breakout. When it happens from the Buy 1 or 2 level below, it is a breakout. But, when you get this move up and it spikes into it, where you find sellers at the Sell 1 level, supply starts to come into the market. The daily and weekly levels of $1739 match, which is a powerful indicator that the market is at a sell level - and is likely to revert back down to the mean.
There’s a 95% daily and 90% weekly probability that if the market closes below that level, it activates a short trigger. We expect that this is going to end this pattern, and we should see a new period come in, in which the price will revert back down to the mean. The weekly mean is about $1711. We are looking at initially the market testing this $1711 to $1715 level. Do not buy up here.
Gold is trying to define the distribution of supply. If the price trades and closes using the 15-minute bar below $1739, it would activate a weekly and daily short signal. We are holding DUST. Hold onto it. There is no margin. No one can pick the top or bottom of the market. But if there is a top being made, the VC PMI will validate it and confirm it for you. It will tell you the area where the top is to be expected. The signal is going against the bullish gold sentiment. That is common.
It appears the market is setting up a bull trap; a false buy signal using technical analysis, which means all the chart-ists go long and then the market reverts back down. We are long-term bullish, but the sentiment of the market is extremely bullish. Gold appears to be at a peak. We want to go long on pullbacks. The probability from here is that sellers will come into the market, and we will have a short-term top and a swing correction to test the level of demand.
Long term, gold may reach $1803, which we forecasted on September 28, 2019, in our annual report. The monthly is trading above the average price of $1686, which is bullish, but the annual price is telling us that we should anticipate sellers to come into the market.
The market may bring into play the Buy 1 monthly level of $1584, and the Buy 2 level $1474. If we close down below $1655, which is the annual Sell 1 level, it would activate the $1417 target on the annual signals. We are looking at an extremely overbought market.
Gold Fundamentals
Gold should be trading at $2,000, given the fundamental news about the Fed pumping money into the economy. The fear is that no matter how much money the Fed throws at this crisis, it is not going to help, which is bullish for gold. With the energy markets going to zero, there is a fear that we may be going into a deflationary spiral.
We seem to be pumping money into the economy with no regard for the inflationary risks down the road. They did not do that in 2008. The debt has almost doubled since 2008. The risk of derivatives that the central banks are carrying are in the $2 quadrillion level. Interest rates are at zero and potentially negative. It is a perfect storm for bullish prices long term in gold.
E-mini S&P 500
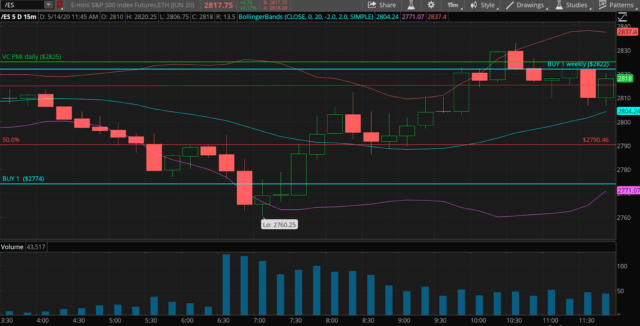
Source: TDAmeritrade
The E-mini is coming down to a Buy 1 level, which is an area where buyers are likely to come into the market. We are trading below the Buy 1 daily. We are trading between the Buy 1 and Buy 2 level, so you don’t want to sell in this area.
There is a high probability that the price will revert to the mean from this area. There is a 90% probability that the market will revert to the mean, and only a 10% chance that the market will continue to go down. We look for high probability trades, not low probability trades.
If it closes above 2774 on the 15-minute bar, it activates a buy trigger with a 90% probability. That’s the trade we want to take. Aggressive traders can enter the market at the opening after the close of the first bar. We got a buy signal, so we are now long the E-mini at 2775.50. You can use the maximum dollar amount as a stop, whatever amount is comfortable for you.
We do not use straight stops. Stops get stopped out constantly. You can use a stop on the pivot point right below the level that activated the signal on the close of the 15-minute bar. You can also do a dollar stop or a trailing stop. You can enter on the close above and add another position, which is a conservative entry point. The third stop is to run the risk for the rest of the day. The market is coming down into an area where the VC PMI is telling you to accumulate positions.
The odds highly favor that the market is going to revert from here. So you do not want to go short. You want to go long. Be disciplined and follow the recommendations of the VC PMI. It is completely systematic, unemotional, and straightforward. You just have to let it lead you about when to enter and exit the market.
Weekly Buy 1 level is 2822 and the daily mean of 2825 are targets that are activated when the signal is triggered. The area below 2774 becomes a high probability area to buy the market. Do not go short below the Buy 1 level or the Buy 2 level. They have a 90% and 95% probability of the market reverting back up from those levels.
Disclosure:
I am/we are long DUST.
I wrote this article myself, and it expresses my own opinions. I am not receiving compensation for it (other ...
more

