
Gold Prices Turned? Crude Oil Looking To Extend Gains After OPEC+ Deal
Gold prices extended gains for a third consecutive day, as expected from earlier this week based on signals in retail trader positioning. The anti-fiat yellow metal capitalized on weakness in the US Dollar as well as a pullback in longer-dated Treasury yields. Crude oil prices marched higher as well, especially during Friday’s Asia Pacific trading session as the commodity climbed over 1.5 percent.
WTI surged in the aftermath of OPEC+ reaching a compromise to taper output cuts in January by 500k barrels per day. This was smaller than expected as participating nations avoided a deal breakdown. The impact on supply coupled with vaccine progress helped push near-term crude oil futures contracts above longer-dated ones. As a result of the outlook, spreads between January 2021/2022 WTI hit the highest since early 2020.
Despite news that Pfizer will cut its coronavirus vaccine distribution target by half, Wall Street futures are pointing slightly higher heading into the European and North American trading sessions. This might have been due to reports from Moderna that its vaccine has the potential for durable immunity. Candidates from an earlier trial experienced ‘high levels of neutralizing antibodies’ 3 months following their first dose (of two).
All eyes for commodity traders will turn to US non-farm payrolls data over the remaining 24 hours. Jobs growth is expected to slow to 475k in November from 638k prior as unemployment ticks lower to 6.8% from 6.9%. A disappointing outcome could risk capping gains in crude oil with a reaction in XAU/USD looking more unclear. A stronger US Dollar could hurt the yellow metal, but falling Treasury yields may offset losses.
Gold Technical Analysis
Gold prices have confirmed a breakout above a bullish Falling Wedge chart pattern, opening the door to extending gains. However, the 20-day and 50-day Simple Moving Averages remain key places of immediate resistance. These could keep the focus for XAU/USD tilted to the downside as the yellow metal faces the former 1848 – 1863 support zone which may stand in the way as new resistance.
XAU/USD Daily Chart
(Click on image to enlarge)
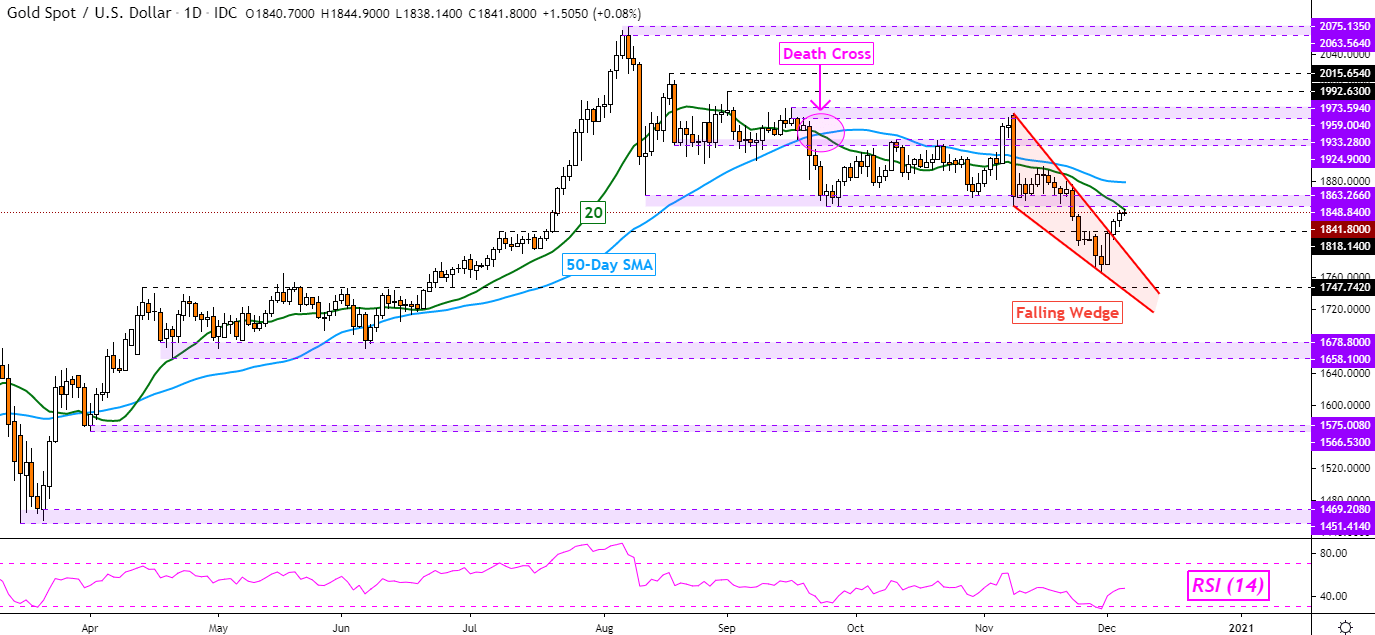
Chart Created Using TradingView
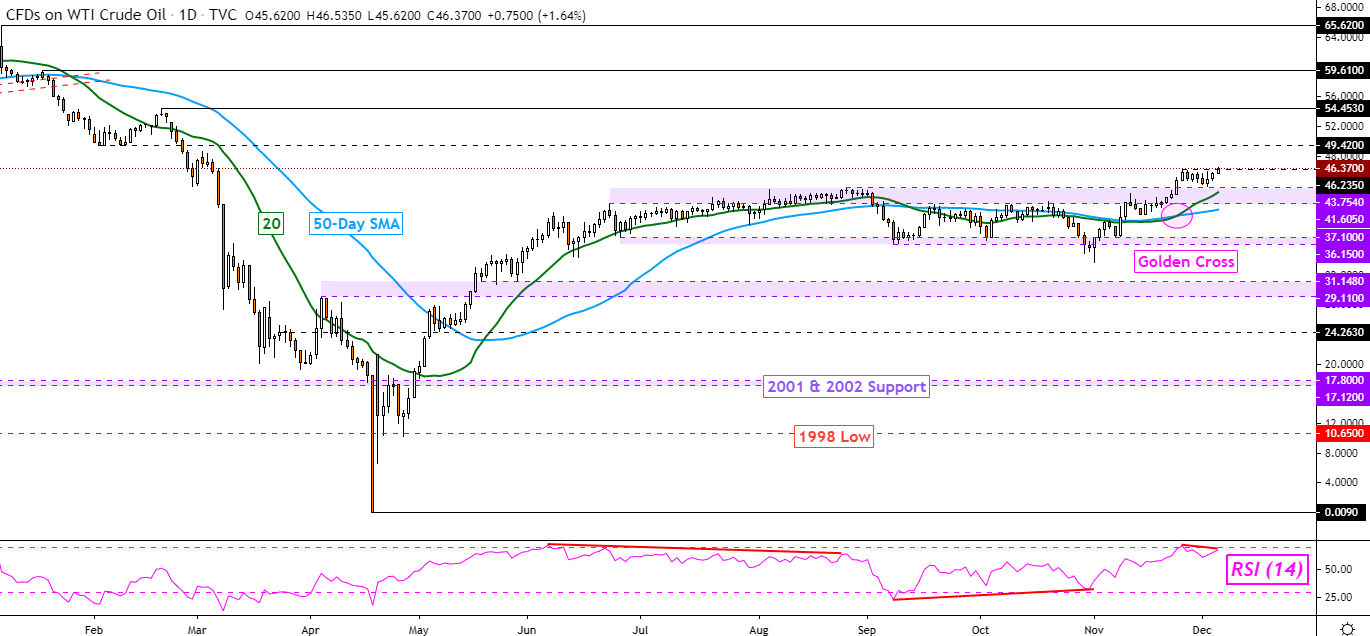
Crude Oil Technical Analysis
Crude oil is attempting to close above the November 25th high, exposing the 49.42 inflection point. This follows the emergence of a bullish ‘Golden Cross’ after the short-term 20-day SMA crossed above the medium-term 50-day one. While this may signal more gains to come, do note that negative RSI divergence shows that upside momentum is fading.
WTI Crude Oil Daily Chart
(Click on image to enlarge)
Disclosure: See the full disclosure for DailyFX here.


