
Gold Prices Turn Higher Alongside US Dollar Breakout - Will It Last?
Amid a fresh escalation of tensions in the US-China trade war, global financial markets have quickly shifted into a ‘risk off’ mindset. The latest news is coming on the back of the May FOMC minutes that highlighted a “patient” Federal Reserve in no hurry to cut rates this year. The combined perception of no de-escalation of the US-China trade war and a not-so-dovish Fed may have turned the tides in risk appetite.
With US equity markets dropping at the open on Thursday, the bid for safe have assets has increased, with US Treasury rallying alongside the Japanese Yen and the US Dollar. As is typical, the aggregate impact of lower US Treasury yields, lower US stock prices, and a stronger Japanese Yen are all the makings of a good day for gold prices.
Indeed, gold prices are having their strongest day since May 13 despite the fact that the US Dollar (via the DXY Index) is on the cusp of a bullish breakout attempt. It’s unusual to see both gold and the US Dollar trade in tandem – unless viewed through the lens of risk aversion.
In an environment where these safe haven instruments are rallying together, it also means that rising volatility is a factor that traders need to be mindful of when contemplating their risk management strategies. Rising volatility may be bad for most assets, but in the case of gold prices, rising gold volatility usually goes in hand with strong price action.
Gold Price Technical Analysis: Daily Chart (April 2018 to May 2019) (Chart 1)
(Click on image to enlarge)
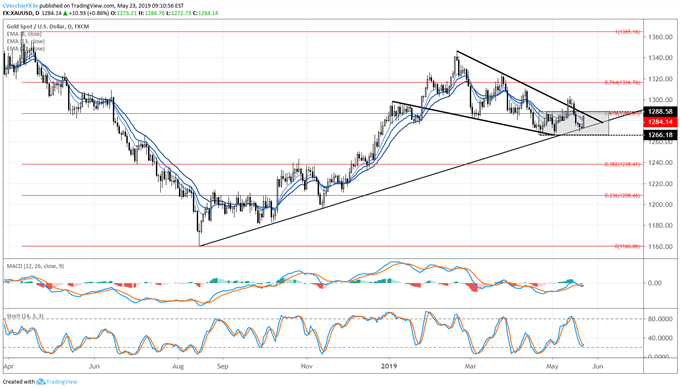
The gold price technical forecast is little changed in recent days despite the perception of US-China trade war news and the May FOMC minutes. Shutting out the noise, it still holds that the sideways range established since mid-April is still being respected. If gold prices move above 1288.58, we would again be looking at the topside break of the consolidation as well as the downtrend from the February and March 2019 highs, while, a drop below 1266.18 would constitute a downside break of the consolidation as well as the uptrend from the late-2018 swing lows.
IG Client Sentiment Index: Spot Gold Price Forecast (May 20, 2019) (Chart 2)
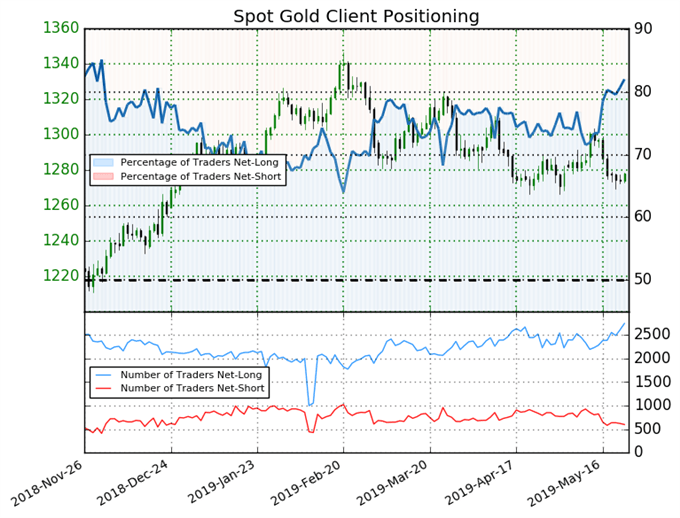
Spot gold: Retail trader data shows 82.0% of traders are net-long with the ratio of traders long to short at 4.56 to 1. The percentage of traders net-long is now its highest since November 05 when it traded near 1230.99. The number of traders net-long is 8.6% higher than yesterday and 16.9% higher from last week, while the number of traders net-short is 11.4% lower than yesterday and 26.3% lower from last week.
We typically take a contrarian view to crowd sentiment, and the fact traders are net-long suggests spot gold prices may continue to fall. Traders are further net-long than yesterday and last week, and the combination of current sentiment and recent changes gives us a stronger spot gold-bearish contrarian trading bias.


