Friday, February 28, 2020 2:47 PM EDT
Risk aversion in markets hit a fever pitch in recent days as coronavirus fears inject worry over the global economies’ ability to weather its impact. Despite the severe move seen across markets today, prompted by increasing concerns over the coronavirus, gold sold off along with equities to defy its more common negative correlation with the growth-sensitive asset class.
SPOT GOLD (1-MIN CHART)
(Click on image to enlarge)
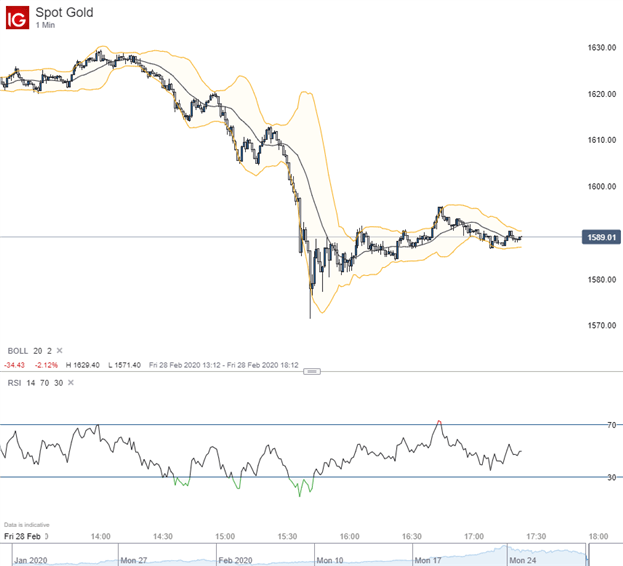
In recent months, gold has strengthened considerably and approached overbought conditions prompting traders to look for near-term consolidation. Spot gold started the week higher, gapping up in Sunday night trading to $1660.11, but began trading lower through the week. Friday saw the biggest intraday selloff in the yellow metal since 2013, as it dropped over 3.5 percent intraday.
(Click on image to enlarge)
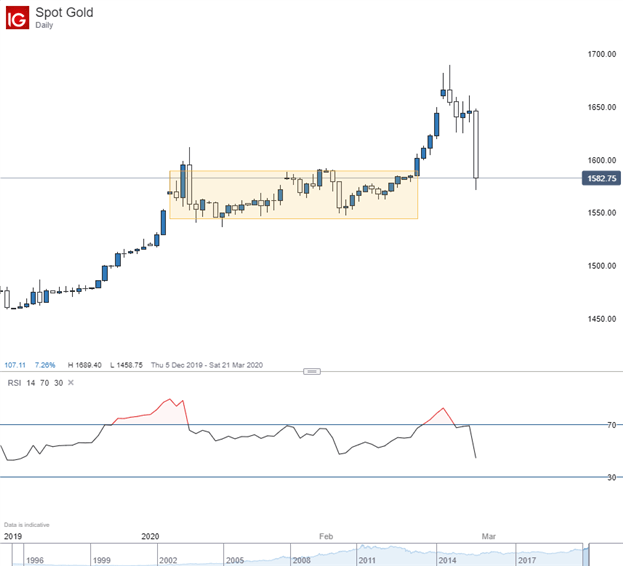
Currently sitting at $1584.40, support from consolidation formed throughout January and February could buoy price from a further move down in the short term. Furthermore, continued deterioration in market sentiment could prompt gold to fall further as investors rotate capital into highly liquid assets such as cash and US treasuries.
SPOT GOLD (DAILY CHART)
(Click on image to enlarge)
Disclaimer: DailyFX, the free news and research website from IG, is one of the world's leading sources for news and analysis ...
more
Disclaimer: DailyFX, the free news and research website from IG, is one of the world's leading sources for news and analysis on the currency, commodity and index trading community. With nine internationally-based analysts publishing over 30 articles and producing 5 video news updates daily, DailyFX offers in-depth coverage of price action, predictions of likely market moves, and exhaustive interpretations of salient economic and political developments. DailyFX is also home to one of the most powerful economic calendars available on the web, complete with advanced sorting capabilities, detailed descriptions of upcoming events on the economic docket, and projections of how economic report data will impact the markets. Combined with the free charts and live rate updates featured on DailyFX, the DailyFX economic calendar is an invaluable resource for traders who heavily rely on the news for their trading strategies. Additionally, DailyFX serves as a portal to one of the most vibrant online discussion forums in the forex trading community. Avoiding market noise and the irrelevant personal commentary that plague many forex blogs and forums, the DailyFX Forum has established a reputation as being a place where real traders go to talk about serious trading.
Any opinions, news, research, analyses, prices, or other information contained on dailyfx.com are provided as general market commentary and does not constitute investment advice. Dailyfx will not accept liability for any loss or damage, including without limitation to, any loss of profit, which may arise directly or indirectly from use of or reliance on such information.
less
How did you like this article? Let us know so we can better customize your reading experience.


