
Gold Prices Slip From 1-Month Peak On Coronavirus Slowdown Hope
Gold prices remained up on the day but returned some of the gains which took them to one-month peaks earlier in the Asian session as riskier assets such as regional equity rose on hopes that the coronavirus’ spread can be contained.
Data showed a slowdown in US infections, although it’s much too early to call a trend. Death rates in some of the hardest-hit areas of Europe also showed signs of slowing down, notably in Spain and Italy.
A stronger US Dollar seems also to be capping dollar-denominated bullion, although prices remain very well supported overall.
The procession of global interest rate cuts made in attempts to offset the contagion’s worst economic effects has supported non-yielding gold by sending risk-free bond yields lower. However, that procession was halted Tuesday when the Reserve Bank of Australia opted to leave its own base rates on hold at record lows, rather than cutting them to zero as markets had expected.
Still, two reductions in March had already taken the Official Cash Rate down to 0.25%.
Crude oil prices continued to gain Tuesday as hopes remained high that major exporters Russia and Saudi Arabia were close to agreeing on the production cuts. The inability to strike a deal on this subject in early March triggered a price war that has seen prices collapse.
According to reports from Reuters the two countries are likely to agree on a reduction when they meet on Thursday, but other countries including the United States will probably also have to do their part to revise prices.
In any case the market still faces a significant demand shock of unknown duration thanks to the coronavirus, whose progress or lack thereof will continue to drive sentiment.
GOLD PRICE TECHNICAL ANALYSIS
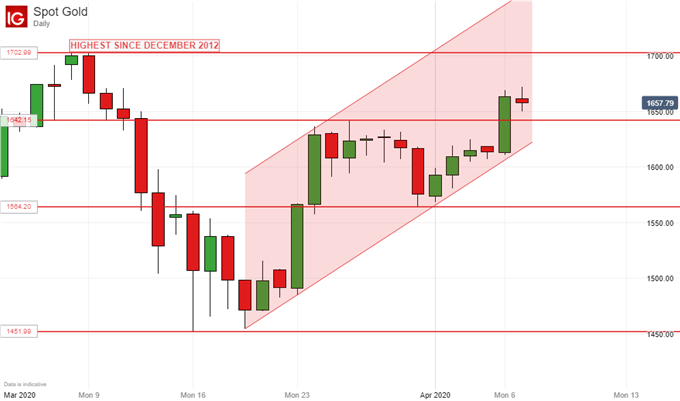
Gold prices have surged above their former range top at $1642.16 and reasserted the importance of their dominant upward daily-char channel. Still, a test of its upside would still mean significant gains and rise beyond even the near-eighteen-year highs of last month. That doesn’t look likely anytime soon, even though the channel looks safe enough. That March high of $1702.99 is firmly in the bulls’ sights as near-term resistance, with that former range top acting as support.
CRUDE OIL TECHNICAL ANALYSIS
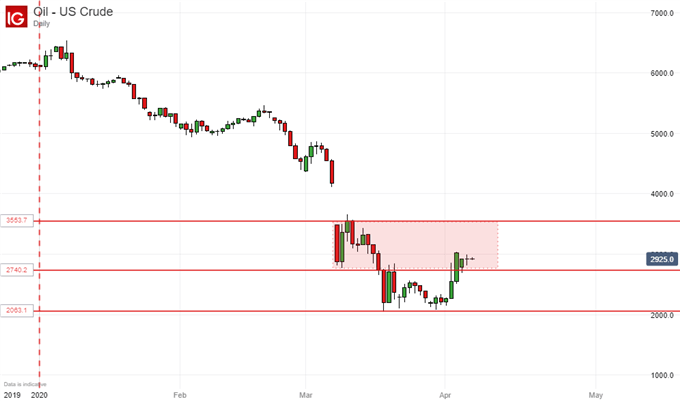
US crude oil prices have added more than $9/barrel from their March lows, although daily ranges seem to be narrowing once again which may indicate that the market is really now waiting to see what the major producers do.
Still, they have edged into a new, higher daily chart range and could challenge the top of it should meaningful production cuts be implemented. That would take prices back above $35/barrel, where they’ve not been since March 10. Reverses will likely find support at $27.40, which was where the market hovered in mid-March.


