Gold Prices Sink, Crude Oil Risks Falling With OPEC+ Meeting In Doubt
Gold prices fell -1.51 percent over the past 24 hours, the worst performance in a day since April 17. The anti-fiat yellow metal was under selling pressure as US government bond yields climbed during Wall Street’s trading session. The Dow Jones also rallied +2.05% as the ‘risk-on’ tone depressed the haven-linked US Dollar. As such, XAU/USD likely focused on falling Treasury prices as demand for safety relaxed further.
What seemed to inspire the optimistic tone in traders was a relatively less-dismal estimate for local job losses from Automatic Data Processing Inc. (ADP). The company anticipates about a 2.7 million reduction in private positions last month. This is significantly lower than the -8 million consensuses for this week’s non-farm payrolls report pulled from Bloomberg surveys.
Despite the rally in global equities, growth-linked crude oil prices were unable to capitalize on the upbeat trading environment. The earlier-than-anticipated June 4 OPEC+ meeting was put into doubt after both Saudi Arabia and Russia expressed reluctance to extend output cuts without more compliance from participating members. The originally scheduled meeting for June 10 is also now in question for the same reason.
This may risk more limbo in crude oil prices, as outlined earlier. Attention ahead turns to the US initial jobless claims report. Over 1.8 million are anticipated to file for unemployment last week, down from 2.1m prior. A softer-than-expected print could underscore expectations of a robust economic recovery. That could dent the yellow metal if government bond yields rise. This is as my Wall Street index tests key resistance.
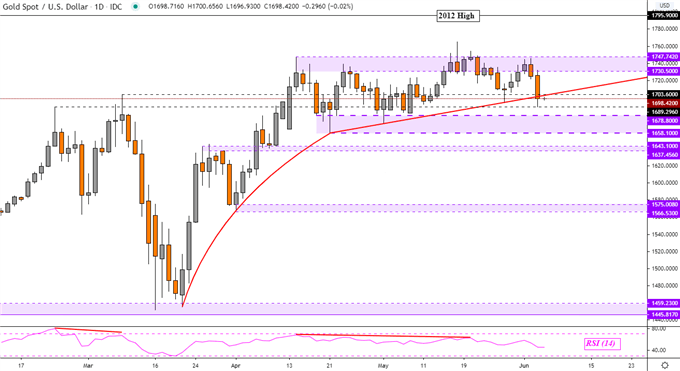
GOLD TECHNICAL ANALYSIS
Gold prices have declined to test rising support from the latter half of May – red line on the daily chart below. This follows rejecting key resistance which is a range between 1730 – 1747. Yet taking out the trend line could need further confirmation to argue that a reversal is in play. This is because key support sits below between 1658 – 1678. A break under the latter may open the door to deeper losses.
XAU/USD DAILY CHART
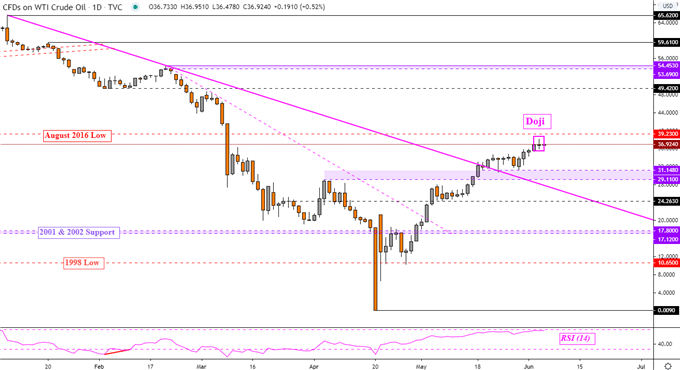
CRUDE OIL TECHNICAL ANALYSIS
WTI crude oil left behind a Doji candlestick on the daily chart below. This is a sign of indecision which has formed just under resistance at 39.23. The latter is the August 2016 low. A close lower after the Doji could increase the risk of a reversal given confirmation. Such an outcome would then place the focus on the inflection range between 29.11 – 31.14. Otherwise, further gains expose early February lows around 49.42.
WTI CRUDE OIL DAILY CHART