Gold Prices Retreat Ahead Of FOMC As Traders Eye Fed Tapering
Gold prices declined during Wednesday’s APAC trading session as traders awaited the FOMC meeting. Although the Fed is widely expected to keep its policy interest rate unchanged, expectations for an earlier withdrawal of its quantitative easing program have been rising. According to a recent Bloomberg survey, nearly half of the polled economists expected the central bank to start tapering its asset-purchases as early as in Q4 this year.

Image Source: Pixabay
This is against the backdrop of robust US economic data, as a string of impressive non-farm payrolls, retail sales, manufacturing PMI and new home sales readings buoy reflation hopes. Corporate earnings have been strong too, with more than 80% of S&P 500 companies reporting better-than-expected results so far in the earnings season.
Reflation hopes boosted Treasury yields, with the longer-dated rates climbing 4-9bps compared to a week ago (chart below). The real yield, as represented by the 10-year inflation-indexed security, rose 1 bps to -0.78% overnight. Rising real yields dampened the appeal of non-interest-bearing precious metals as the opportunity cost of holding them increased. The DXY US Dollar index rebounded for a third day to 91.00, exerting downward pressure on gold prices.
Despite strong economic data released in the US and China recently, growth prospects appear to be uneven in other parts of the world. The adverse economic impact brought on by the third viral wavein Japan, India and Brazil may hinder the Fed from considering tightening monetary policy any time soon.
US Treasury Yield Curve – 1 Week Change
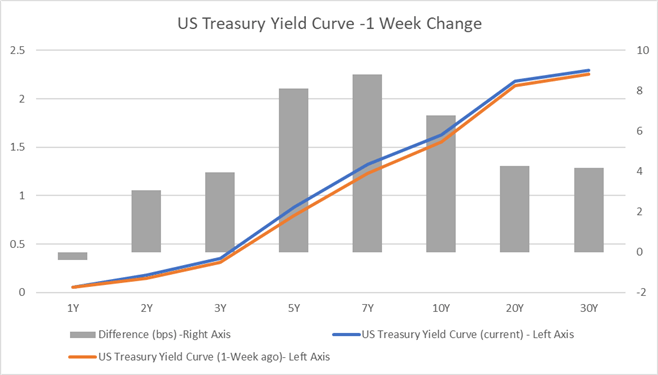
Source: Bloomberg, DailyFX
Looking ahead, US Q1 GDP and Chinese NBS Manufacturing PMI readings dominate the economic calendar alongside the FOMC press conference this week. Stronger-than-expected readings may strengthen yields and the US Dollar further and weigh on precious metal prices.
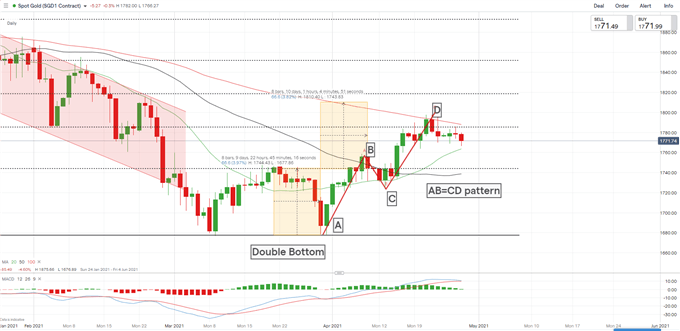
Technically, gold has likely formed a bearish “AB=CD” pattern as highlighted in the chart below. An “AB=CD” pattern is characterized by parallel “AB” and “CD” legs of similar timeframe and magnitude. A pullback from the “D” point is likely following the completion of the pattern.
On the gold chart, the “AB=CD” pattern is part of a larger “Double Bottom” pattern. A “Double Bottom” chart pattern is perceived as a strong bullish indicator. An extension beyond the “D” point higher would likely invalidate the “AB=CD” pattern and open the door for further upside potential with an eye on $ 1,808 – the 50% Fibonacci retracement.
Gold Price – Daily Chart