
Gold Prices Pull Back From $1,900 As Stimulus Tapering Fears Gear Up
Gold prices retreated further during Thursday’s Asia-Pacific trade, pulling back sharply from Wednesday’s intraday high of $1,912. This may be attributed to a drastic shift in sentiment after the Reserve Bank of New Zealand (RBNZ) sounded more hawkish than expected during an interest rate meeting on Wednesday, hinting that it may start to raise interest rates in the second half of 2022. This is the second major central bank that signaled a tapering stimulus, preceded by the Bank of Canada (BoC).
The DXY US Dollar index edged higher to 90.11 this morning, exerting downward pressure on bullion. A strengthening Greenback suggests that traders are jittery about the tapering of Fed stimulus after the RBNZ’s hawkish comments, even though Fed officials tried to convince the market that inflationary pressures might be “transitory”. This puts today’s release of US 1Q GDP, durable goods orders, and weekly jobless claims data in focus. Better-than-expected figures may send the US Dollar higher and gold lower. The two have historically exhibited a negative relationship, with their past 12-month correlation coefficient standing at -0.20 (chart below).
Meanwhile, Friday’s US core PCE price index data will also be under the spotlight as traders assess inflationary pressure and its ramifications for the Fed’s policy outlook. The core PCE rate is expected to come in at 2.9%, hitting the highest level since 1992 partly due to a low-base effect. Concerns surrounding inflation overshoot rendered the market vulnerable to heightened volatility if actual numbers deviate too far from the baseline forecasts.
Gold Prices vs. DXY US Dollar Index
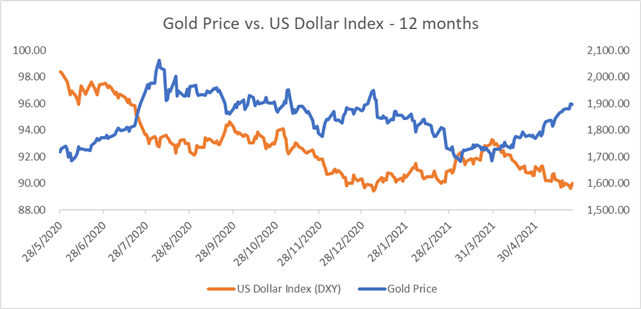
Source: Bloomberg, DailyFX
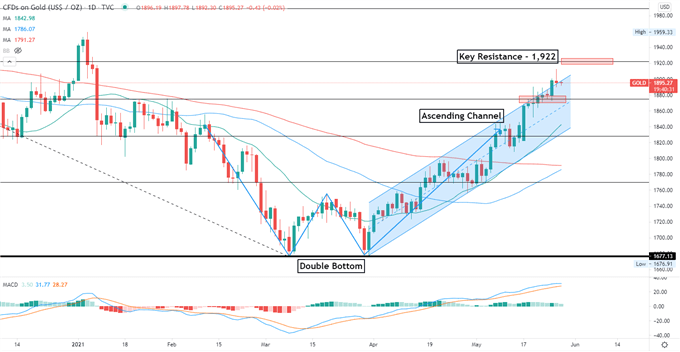
Technically, gold remains in an “Ascending Channel” as highlighted on the chart below. It is formed by consecutive higher highs and higher lows and can be easily recognizable as a trending market. Gold price stretched beyond the ceiling of the “Ascending Channel”, suggesting that it may be temporarily overbought and thus is vulnerable to a minor pullback. Further retracement may lead to a test of $ 1,875 – a previous resistance level – for support.
A firm breakout above the ceiling, however, would likely intensify near-term buying power and open the door for further upside potential towards $ 1,922 – the 61.8% Fibonacci retracement.
The 20- and 50-day SMA lines are about to cross above the 100-day line, potentially forming a “Golden Cross” on the daily chart. A “Golden Cross” is a medium-term bullish indicator and may pave the way for further upside potential. The MACD indicator is trending higher above the neutral midpoint, suggesting that bullish momentum is prevailing.
Gold Price – Daily Chart
Disclosure: See the full disclosure for DailyFX here.


