
Gold Prices May Turn Lower As US Payrolls Data Stokes Reflation Bets
Gold prices managed to find fuel for a spirited recovery having probed below the $1700/oz figure yet again, in a move that appeared to reflect a more modest infrastructure spending proposal from the Biden administration than the markets anticipated. The White House laid out a US$2.25 trillion effort, which fell somewhat short of the US$3 trillion that traders thought was on the menu.

Image Source: Pixabay
The relatively lower price tag appeared to imply less upward pressure on inflation in the minds of traders, which translated into reduced pressure on the Federal Reserve to pull back on its ultra-loose monetary policy stance. Treasury bond yields tellingly drifted lower and the US Dollar backtracked from recent highs, offering a familiar lift to the non-interest-bearing, anti-fiat yellow metal.
The spotlight now turns to the March edition of the closely-watched US employment report. An increase of 660k in nonfarm payrolls is expected, which would amount to the largest monthly wave of job creation since October. Meanwhile, the headline unemployment rate is seen ticking down to a one-year low of 6 percent. Leading PMI and ISM activity surveys bolster the case for a firm result.
Strong jobs data may breathe new life into the ‘reflation’ narrative that has animated markets in recent months, pulling priced-in price growth expectations upward and making the case for a relatively sooner unwinding of Fed stimulus than the central bank has thus far projected. That is likely to bid up bond yields alongside the Greenback once again, capping gold gains.
Gold Technical Analysis
Gold prices popped higher from support near $1680/oz, pushing through downward-sloping resistance guiding them lower since the beginning of the year. While this seems to neutralize near-term selling pressure, buyers have yet to clear support-turned-resistance in the 1747-66 zone. This means that the next phase of trend development may be sideways consolidation, and not necessarily an extended reversal higher.
A daily close resistance looks likely to set the stage for a test of the psychologically significant $1800/oz figure, followed by the 1860-72 congestion area. Alternatively, slipping back below the inflection line at 1719.40 may pave the way for another challenge of the dense 1634.83-79.81 zone, beginning with what is now a would-be “double bottom” marked by the March 8 and 31 lows.
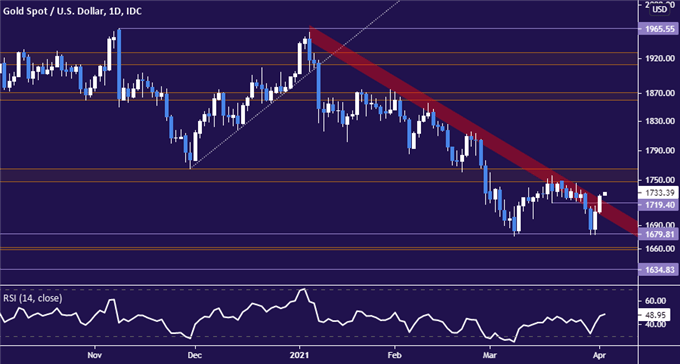
Gold price chart created using TradingView
Disclosure: See the full disclosure for DailyFX here.


Reflation = Return of inflation?????