
Gold Prices May Struggle Despite Chart Break If US Yields Rise
Gold prices continued to rise for a second day, edging up to a two-week high. A downswing in Treasury yields appeared to drive the move upward, boosting the metal’s appeal as an alternative store of value. The rate on the benchmark 10-year note fell and the yield curve flattened. A discreate catalyst is not readily apparent.
Looking ahead, a relatively quiet day on the economic data front might give way to sentiment trends as the primary driver of price action. Bellwether S&P 500 futures are pointing higher, signaling a risk-on tilt that might pull yields higher and weigh on bullion.
The outcome of a 10-year US debt auction may be noteworthy too. An uptick in prevailing yields coupled with healthy demand – echoing the apparent shift away from dovish extremes on Fed monetary policy bets recently – might serve to compound downside pressure.
Gold Technical Analysis
Gold prices have managed to re-establish a foothold above former support in the 1848.66-63.27 area, seemingly opening the door for a push above the $1900/oz figure to challenge the 1911.44-28.82 zone. A daily close back below 1848.66 could see a tun back below $1800/oz, targeting the 1747.74-65.30 region.
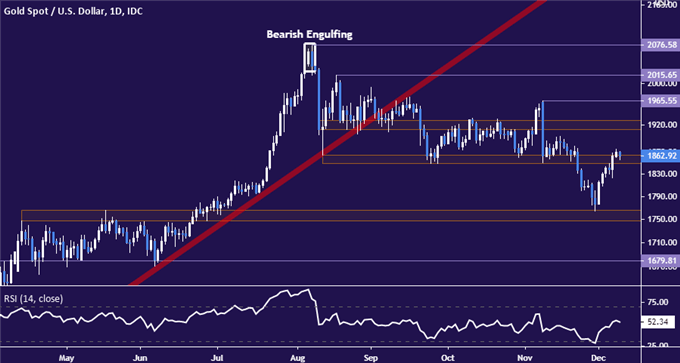
Gold price chart created using TradingView
Crude Oil Prices at Risk as EIA Inventory Data Approaches
Crude oil prices are languishing in consolidation mode having briefly touched a nine-month high last Friday. The weekly EIA crude oil inventories report is in the spotlight, with baseline forecasts pointing to a narrow 849.3k-barrel drawdown.
An analogous industry report from API published yesterday projected a 1.14-million-barrel build over the same period, setting the stage for a disappointment when official figures cross the wires. That might apply some downward pressure, though selling may be capped if broader risk sentiment holds up.
Crude Oil Technical Analysis
Negative RSI divergence suggests upward momentum may be fading, which may set the stage for a pullback in crude oil prices. Sellers face a dense resistance-turned-support block, with a daily close below 41.46 needed to confirm a break toward support near $35/bbl. Resistance is clustered around $50/bbl.
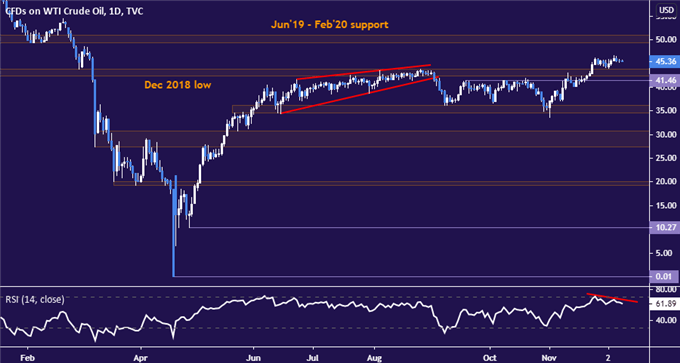
Crude oil price chart created using TradingView
Disclosure: See the full disclosure for DailyFX here.


