Gold Prices May Fall As Sentiment Swell Helps Validate Chart Setup
A narrow pullback in gold prices kept them confined within familiar trading ranges. The yellow metal may find a bit more scope for directional development in the final hours of the trading week as broad-based market sentiment trends gather momentum.
Risk appetite swelled in APAC trade and bellwether S&P 500 futures are pointing convincingly higher, hinting that more of the same is likely ahead. That might translate into higher bond yields as capital flows out of the safe harbor of government debt, punishing non-interest-bearing assets that gold epitomizes.
CRUDE OIL SHRUGS OFF INVENTORIES SURGE, EYES VENEZUELA
Crude oil price action was a bit more spirited. Prices rose despite EIA inventories data showing stockpiles added a hefty 7.97 million barrels last week, smashing expectations of a slight drawdown. The release was foreshadowed by calls for a 6.55-million-barrel rise from API, which might have defanged it.
The subsequent rally may have reflected pent-up upward pressure waiting to be unleashed by the passage of scheduled event risk (i.e. the EIA report). That might have come courtesy of the turmoil in Venezuela. The country looks to be on the brink of a civil war that might disrupt supply flows.
Further gains may be ahead if the markets’ risk-on disposition is sustained through the rest of the trading day. Indeed, the WTI benchmark tracked higher alongside US stock index futures in Asia Pacific session. As with gold however, the move is yet to extend beyond recently prevailing ranges.
GOLD TECHNICAL ANALYSIS
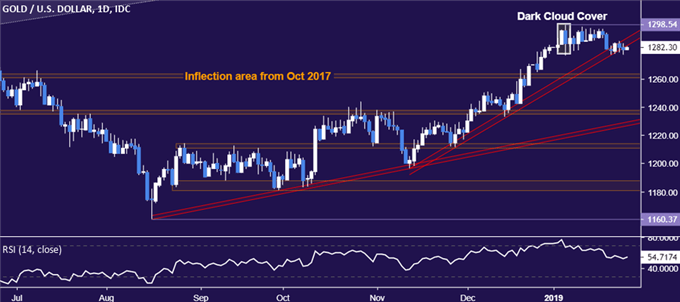
Gold prices narrowly edged below rising trend line support set from mid-November, hinting that follow-through on the bearish Dark Cloud Cover candlestick pattern identified two week ago may finally be at hand. From here, a daily close below support in the 1260.80-63.76 area exposes the 1235.11-38.00 region. Alternatively, a move back above the trend line – now recast as resistance at 1289.00 – puts the January 4 high at 1298.54 back in focus.

CRUDE OIL TECHNICAL ANALYSIS
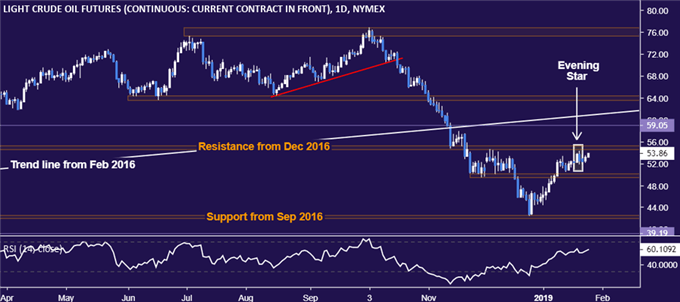
Crude oil prices continue to oscillate below resistance in the 54.51-55.24 area, but a bearish Evening Star candlestick pattern warns that a top may be taking shape. A drop below support in the 49.41-50.15 area sets the stage for a test of the 42.05-55 zone. Alternatively, a daily close above 55.24 would neutralize near-term bearish cues and open the door to challenge the chart inflection point at 59.05.

Disclosure: Do you want to see how retail traders are currently trading the US Dollar? Check out our IG Client Sentiment ...
more


