
Gold Prices May Fall As Market Rout Resumes, Boosting US Dollar
Gold prices are idling in a familiar range above the $1800/oz figure. A cautious recovery in the US Dollar against the backdrop of broad-based market turmoil might have been expected to hurt the anti-fiat metal but for the risk-off backdrop’s downside implications for Treasury bond yields. Haven-seeking capital has buoyed demand for government debt, pressuring rates lower and underpinning non-interest-bearing bullion.
Crude oil prices are likewise idling, with the WTI contract stuck below the $54/bbl handle for the better part of two weeks. The recent rout in the equities space could have been expected to punish the cyclical commodity but inventory data showing larger-than-expected outflow from US storage has seemingly scattered sellers. EIA data this week showed an outflow of 9.9 million barrels, the largest drawdown in six months.
Looking ahead, the US PCE inflation gauge – the Fed’s favored price growth measure – headlines a relatively staid economic data docket. The on-year growth rate is seen rising to 1.2 percent, marking the first increase in four months. US inflation data has outperformed relative to forecasts in recent months. That may foreshadow an upside surprise that cools any lingering Fed stimulus expansion bets, hurting gold and crude oil alike.
The broader sentiment backdrop seems perilous as well. Bellwether S&P 500 futures point firmly lower ahead of the opening bell on Wall Street, suggesting that yesterday’s rebound following Wednesday’s bloodletting may give way to renewed liquidation. That is likely to push USD upward anew, pressuring commodities. Coupled with firm PCE results that underpin yields, sellers could have scope to break congestion.
Gold Technical Analysis
Gold prices are treading water in a familiar range above the $1800/oz mark. A daily close below support at 1817.13 may expose former resistance in the 1747.74-65.30 zone. Alternatively, a push above the 1860-71.34 area could see another test above the $1900/oz figure. In all, the near-term bias seems bearish.
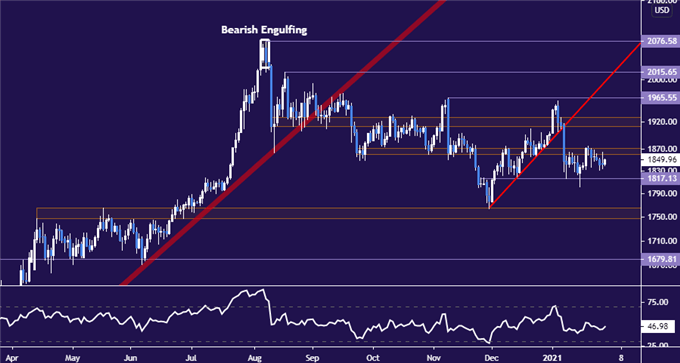
Gold price chart created using TradingView
Crude Oil Technical Analysis
Crude oil prices are marking time just below the $54/bbl figure. A daily close above that may bring the $56/bbl mark into view. Immediate support sits in the 49.41-51.03 inflection zone. Establishing a foothold back below that might bring a test below the $48/bbl handle.
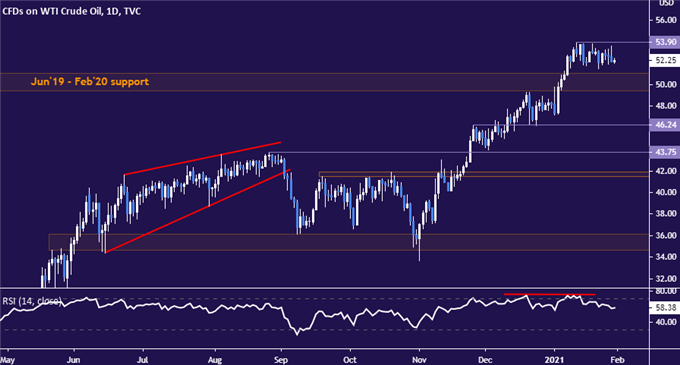
Crude oil price chart created using TradingView
Disclosure: See the full disclosure for DailyFX here.


