
Gold Prices Eye Consumer Confidence Data As Technical, Positioning Signals Clash
Gold prices aimed cautiously higher on Monday as the anti-fiat yellow metal continued its near-term uptrend since the beginning of October. The direction of the US Dollar and Treasury yields often have key influences on XAU/USD. Since the Greenback was relatively flat to start the week, it was the performance in US government bonds that likely boosted gold prices.

Image Source: Pixabay
The 10-year Treasury yield dipped cautiously, but the move was not as aggressive as what was seen at the front-end. The 2-year bond yield dropped almost 4% on Monday, bringing it down to roughly 0.43% from last week’s close of about 0.46%. This could reflect ebbing hawkish Federal Reserve policy expectations following persistent gains since late September.
Falling yields can make the non-interest-bearing asset relatively more attractive. During Tuesday’s Asia-Pacific trading session, Treasury yields cautiously climbed, sending the yellow metal lower. Over the remaining 24 hours, gold will face US Conference Board Consumer Confidence data. A decline to 108.3 in October from 109.3 prior is expected. A worse outcome could weaken hawkish Fed bets, opening the door to a rise for the yellow metal.
Gold Technical Analysis
Gold continues to struggle around the 1808 – 1800 inflection zone on the 4-hour chart below. The most recent rejection was met with negative RSI divergence, showing that upside momentum was fading. That may open the door to a turn lower, placing the focus on the floor of a Rising Channel. A subsequent bounce off the floor may see prices resume the uptrend.
XAU/USD 4-Hour Chart
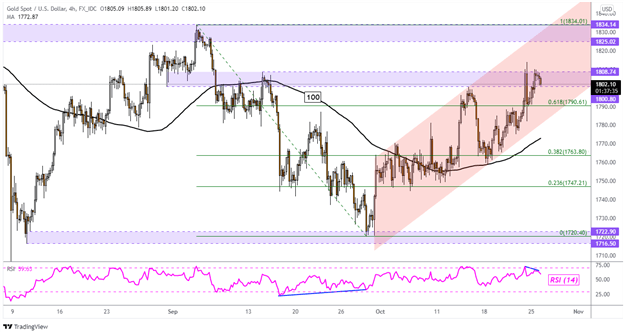
Chart Created Using TradingView
Gold Sentiment Analysis - Neutral
According to IG Client Sentiment (IGCS), roughly 72% of retail traders are net-long XAU/USD. Short positioning is on the rise, increasing by 30.33% and 34.37% over a daily and weekly basis respectively. IGCS typically acts as a contrarian indicator. Since the majority of investors are net-long, the yellow metal may fall. But, recent shifts in positioning are producing a bullish-contrarian trading bias.
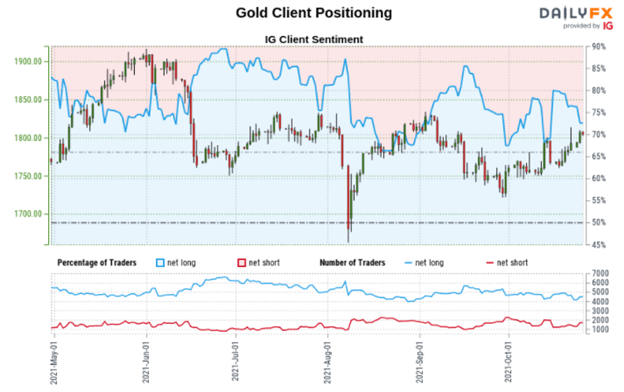
*IGCS chart used from October 25th report
Disclaimer: See the full disclosure for DailyFX here.


