
Gold Prices Extend Lower As Traders Eye FOMC For Tapering Clues
Gold prices extended lower during Wednesday’s APAC session as the US Dollar and 10-year Treasury yield edged higher. Bullion lost more than 2% of its value since last Thursday, as expectations were built surrounding the Fed’s timeline to scale back asset purchases in the two-day FOMC meeting. Although any actions may be months away, a debate about when and at what pace to withdraw the central bank’s $120 billion per month bond purchase will be closely scrutinized by traders.
The recent rise in inflation, ample liquidity conditions, and robust economic recovery may support this view, rendering bullion prices vulnerable to further pullback if Fed officials give clarity about the tapering timeline. On the flip side, if the Fed remains dovish and hints at a further delay in the debate, gold prices may embrace a relief rebound.
US producer price index (PPI)climbed 0.8% MoM in May, more than a baseline forecast of 0.6%. This reflects that prices of goods at factory doors are rising at a faster-than-expected pace, echoing readings from China and Japan earlier this month. PPI is widely perceived as a leading indicator for CPI, as producers may intend to transfer higher input costs to finished products. Therefore, inflationary pressures may be seen in the months to come and may strengthen the case of tapering the Fed stimulus. Against this backdrop, the DXY US Dollar index is trading near a one-month high of 90.54, exerting downward pressure on the yellow metal (chart below).
Gold Price vs. US Dollar Index – 12 Months
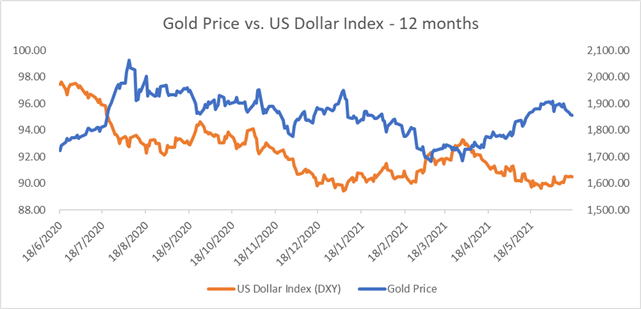
Source: Bloomberg, DailyFX
Looking ahead, Canadian inflation and US housing starts data dominate the economic docket alongside FOMC interest rate decision. Thursday’s weekly initial jobless claims data and Treasury Secretary Janet Yellen’s testimony will also be in focus.
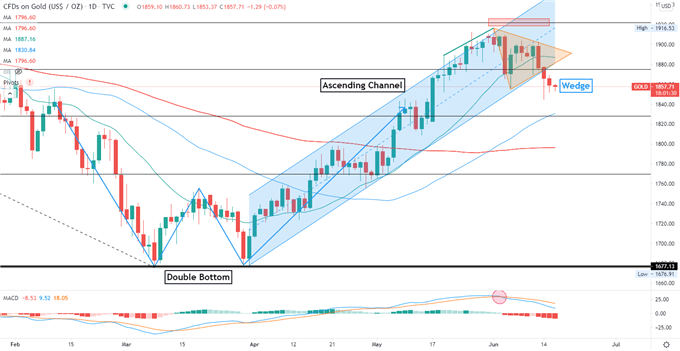
Technically, gold prices breached below an “Ascending Channel” formed since early April and have since entered a technical correction. Prices also broke a “Wedge” as highlighted on the chart below, suggesting that the near-term trend has likely turned bearish. An immediate support level can be found at $1,828 – the 38.2% Fibonacci retracement. The MACD indicator formed a bearish crossover and trended lower, signaling that further price weakness may be seen.
Gold Price – Daily Chart
Disclaimer: See the full disclosure for DailyFX here.


