Gold Prices Breach Key Chart Resistance And Eye Further Upside Potential
Gold prices advanced more than 1% on Monday to 7-week highs after clearing a key chart resistance at US$ 1,910. Worsening viral situations around the globe reignited hopes for more monetary and fiscal support, propelling a rally in precious metals and cryptocurrencies on the first trading day of 2021. The US Dollar index fell to a two-and-half year low of 89.65 and looked set to continue its downward trajectory amid a viral resurgence and ample liquidity.
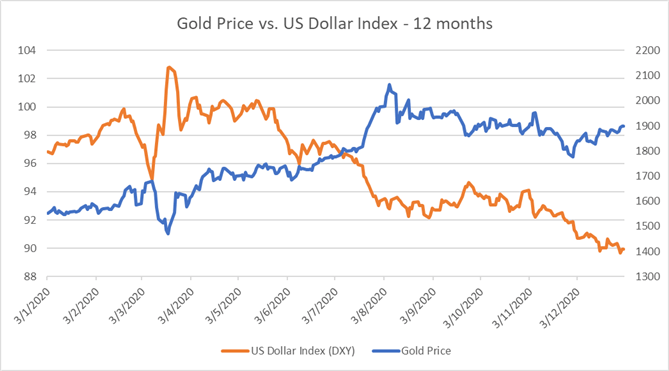
Gold prices and the DXY US Dollar Index historically exhibit a negative relationship, with a correlation coefficient of -0.79 over the past 12 months (chart below).
Gold Prices vs. DXY US Dollar Index – 12 Months

Source: Bloomberg, DailyFX
The US registered a record 291,384 daily Covid-19 cases on January 2nd, while Tokyo is planning to declare a state of emergency as a resurgence of infections strained the healthcare system. Last week, President Donald Trump signed US$ 2.3 trillion US stimulus package that includes US$ 900 billion in Covid-relief aid and a US$ 1.4 trillion in general government spending. Gold prices, alongside cryptocurrencies, appear to be riding the tailwind of stimulus and a seemingly broad consensus that central banks will largely stay accommodative as the pandemic worsens.
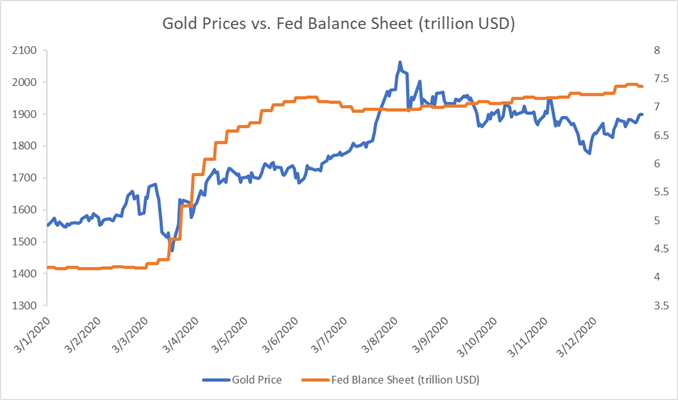
Bullion has long been perceived as a store of value and hedge against inflation, albeit it has somehow lost its role as a safe-haven asset in recent quarters and moved more in tandem with risk assets. The unprecedented monetary easing carried out by global central banks has propelled an exuberant rally in gold prices from March through to August 2020 (chart below). Prices have since entered a four-month consolidation, falling as much as 15% from an all-time high of US$ 2,075 observed on August 7th. Recently, gold appeared to have regained strength and looked set to reverse its downward trajectory.

Source: Bloomberg, DailyFX
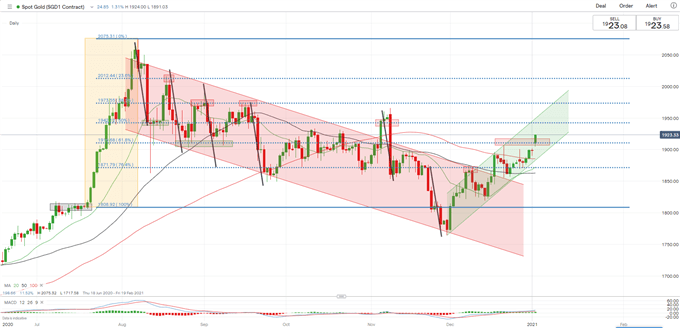
Technically, gold prices have likely broken above a “Descending Channel” and entered into a bullish channel (chart below). Prices have formed consecutive higher highs and lows in December– an encouraging pattern that points to a potential medium-term trend reversal. Piercing through a key chart resistance of US$ 1,910 (the 61.8% Fibonacci retracement) may have opened the door for further upside potential with an eye on US$ 1,940 (50% Fibonacci retracement).
Gold Price – Daily Chart

IG Client Sentiment indicates that retail gold traders are leaning heavily towards the long side, with 80% of positions net long, while 20% are net short. Traders have added long (+6%) while reducing short (-7%) positions overnight. Compared to a week ago, traders have increased short (+16%) bets while keeping long exposure (+1%) largely unchanged.
Disclosure: See the full disclosure for DailyFX here.


