
Gold Price Rally Pushes RSI Into Overbought Territory
The price of gold has cleared the February high ($1872) after pushing back above the 200-Day SMA ($1844), and precious metal may approach the yearly high ($1959) as a growing number of Federal Reserve officials warn of a transitory rise in inflation.
However, the minutes from the April meeting revealed a growing discussion within the FOMC to scale back the emergency measures as “a number of participants suggested that if the economy continued to make rapid progress toward the Committee's goals, it might be appropriate at some point in upcoming meetings to begin discussing a plan for adjusting the pace of asset purchases.”
In turn, the FOMC may gradually change its tone over the coming as “continued progress on vaccinations and accommodative monetary and fiscal policies most likely would underpin further gains in economic activity,” and it remains to be seen if the central bank will adjust the forward guidance at its next interest rate decision on June 16 as Fed officials are slated to update the Summary of Economic Projections (SEP).
Until then, the dovish forward guidance may keep the price of gold afloat as “participants agreed that the economy was still far from the Committee's longer-run goals,” but speculation for a looming change in Fed policy may underpin the rise in longer-dated US Treasury yields as “participants assessed that risks to the outlook were no longer as elevated as in previous months.”
In turn, the decline from record high ($2075) may underscore a change intrend as the price of gold broadly reflects an inverse relationship with US yields, but the precious metal managed to establish a double bottom formation in March, with the key reversal pushing the precious metal above the 200-Day SMA ($1844) for the first time since February.
With that said, the price of gold may attempt to test the yearly high ($1959) as the Relative Strength Index (RSI) pushes into overbought territory, and the move above 70 in the indicator is likely to be accompanied by higher gold prices like the behavior seen in July 2020.
GOLD PRICE DAILY CHART
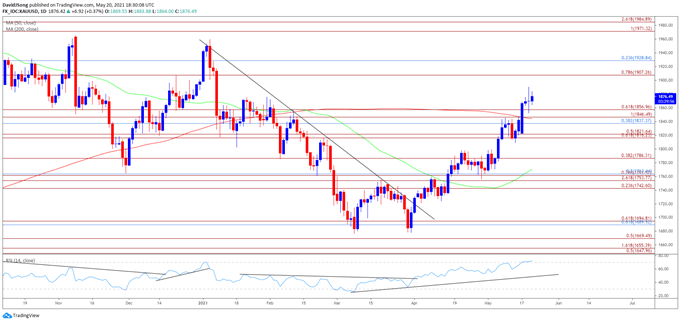
Source: Trading View
- Keep in mind, the price of gold pushed to fresh yearly highs throughout the first half 2020, with the bullish price action also taking shape in August as the precious metal tagged a new record high ($2075).
- However, the bullish behavior failed to materialize in September as the price of gold traded below the 50-Day SMA ($1770) for the first time since June, with developments in the Relative Strength Index (RSI) negating the wedge/triangle formation established in August as the oscillator slipped to its lowest level since March.
- Nevertheless, a double-bottom emerged in 2021 as the price of gold failed to test the June 2020 low ($1671), with the key reversal pattern pushing the precious metal back above the 200-Day SMA ($1844) for the first time since February. $1857 (61.8% expansion).
- The price of gold may continue to retrace the decline from the yearly high ($1959) as the RSI pushes into overbought territory, with the move above 70 in the indicator likely to be accompanied by higher gold prices like the behavior seen in July 2020.
- The break above the $1857 (61.8% expansion) region brings the Fibonacci overlap around $1907 (78.6% expansion) to $1929 (23.6% expansion) on the radar, with move above the yearly high ($1959) opening up the $1971 (100% expansion) to $1985 (261.8% expansion) area.
Disclosure: See the full disclosure for DailyFX here.


