
Gold Price Rally May Be Set To Resume Rally To Fresh 2019 Highs
After a huge rally at the end of May and the beginning of June, gold prices have settled into an approximate $30 range over the past week. But it’s not just gold prices: volatility has cooled across the board, with bonds, currencies, equities trading in tighter ranges in recent days. Following the Mexico tariff ceasefire at the end of last week, it feels as if traders are taking a collective sigh of relief ahead of the June Fed meeting next week. Now, with most of the week in the rearview mirror, traders are looking ahead to risks around the corner.
GOLD VOLATILITY STARTING TO INCREASE AGAIN
With the June Fed meeting next week likely to signal the end of the Fed rate hike cycle and the start of the Fed rate cut cycle, traders have started to factor in greater uncertainty around gold prices – a good sign for bullion. Whereas other asset classes don’t like increased volatility (signaling greater uncertainty around cash flows, dividends, coupon payments, etc.), precious metals tend to benefit from periods of higher volatility as uncertainty increases the appeal of gold’s and silver’s safe-haven appeal.
GVZ (GOLD VOLATILITY) TECHNICAL ANALYSIS: DAILY PRICE CHART (JUNE 2018 TO JUNE 2019) (CHART 1)
(Click on image to enlarge)
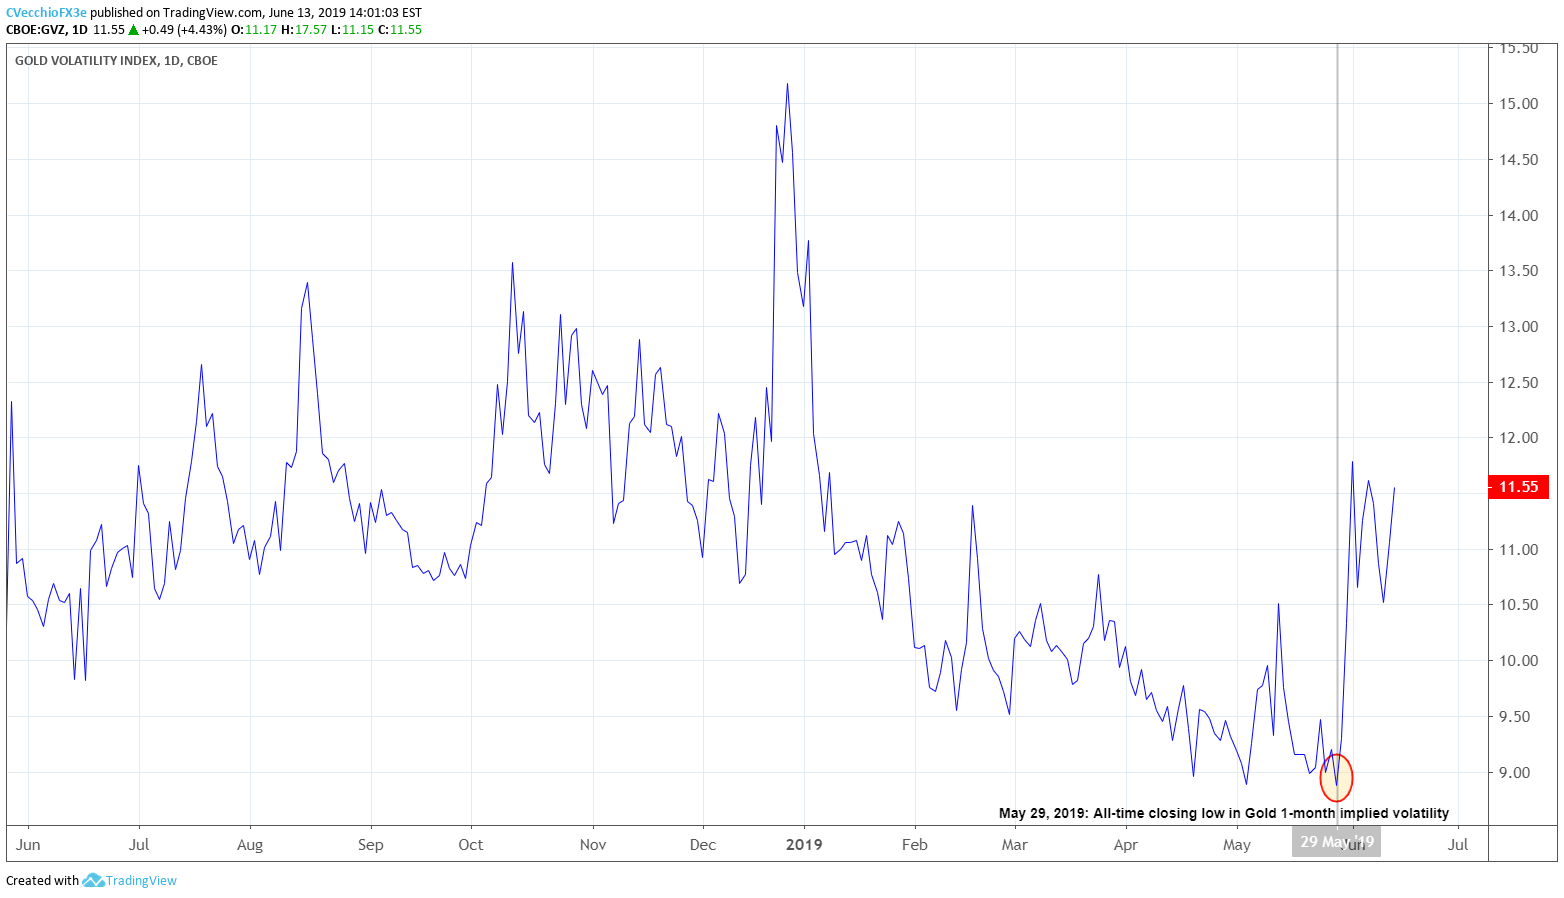
After pressing lower over the past several days, gold volatility (as measured by the Cboe’s gold volatility ETF, GVZ, which tracks the 1-month implied volatility of gold as derived from the GLD option chain) has moved up back towards its June high, suggests that gold prices may be facing an easier environment in the near-term.
GOLD PRICE PULLBACK MIRRORED OTHER EPISODES
In the month of June, we’ve been carefully watching the gold price rally. Last Wednesday, gold prices moved more than 2% above their daily 21-EMA for just the fifth time since the gold price bottom developed in Q3’19. In the four previous instances, gold prices averaged a 1-week return of -0.49%. As such, at the time it was noted that “the risk for exhaustion setting in again soon and cutting the rally short is increasing.”
After hitting a high of 1348.13 last Wednesday, June 5, when gold prices first moved more than 2% more than the daily 21-EMA, gold prices came down -0.81% to where they closed yesterday, Wednesday, June 12.
GOLD PRICE TECHNICAL ANALYSIS: DAILY CHART (APRIL 2018 TO JUNE 2019) (CHART 2)
(Click on image to enlarge)
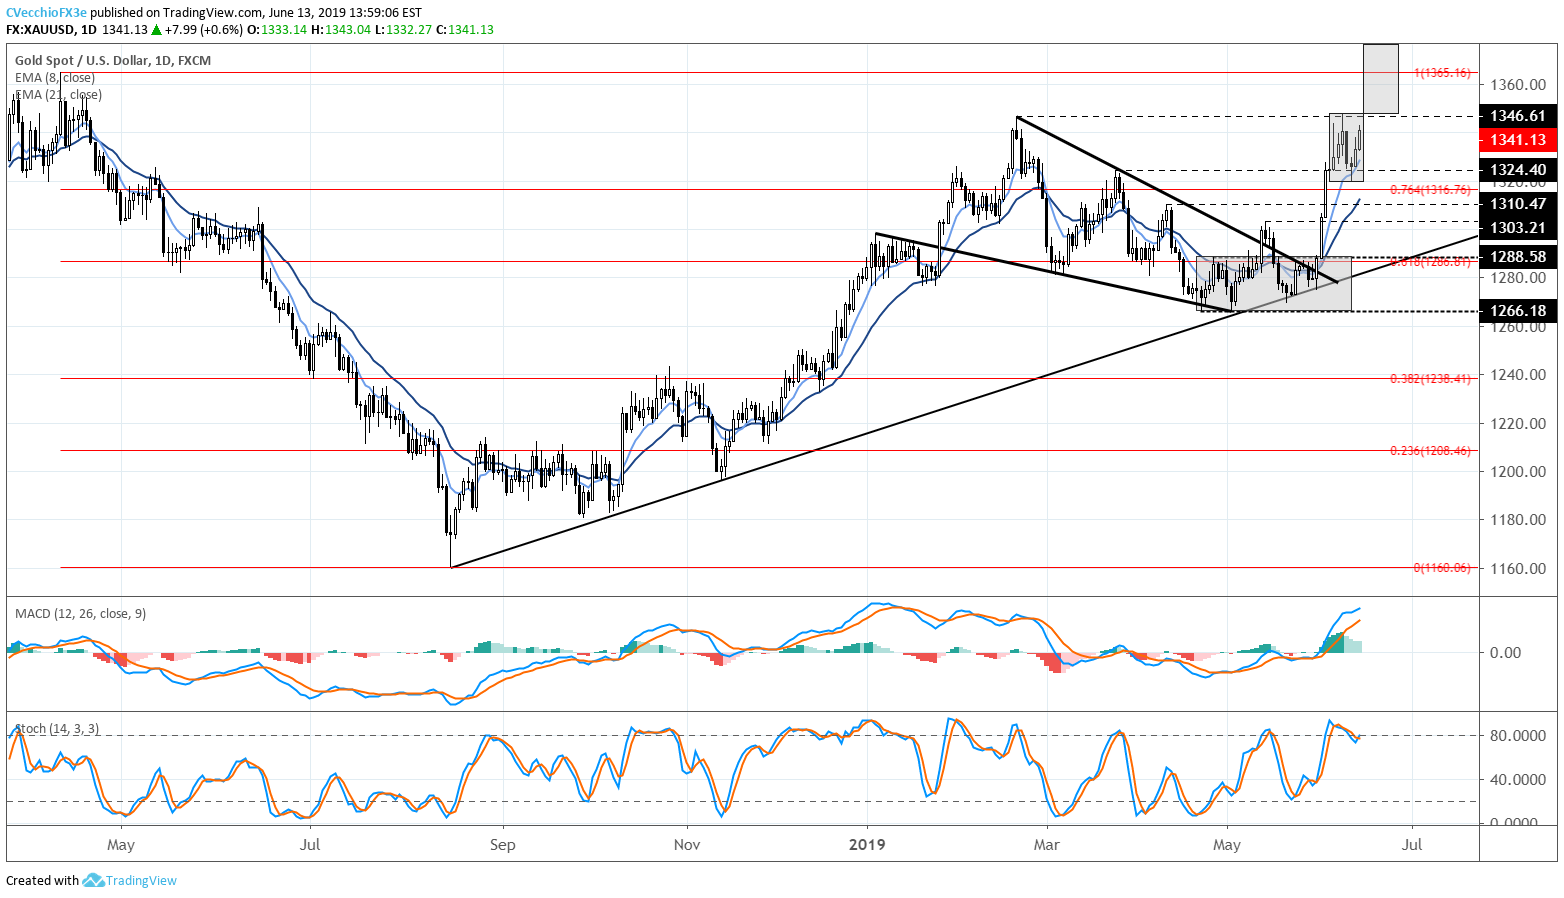
Now that the episode where the gold price move in excess of 2% of the daily 21-EMA signaled near-term exhaustion has behaved similar to the prior four episodes, then the healthy correction in gold prices may have run its course; the longer-term uptrend is still valid.
Earlier this week it was noted that “former resistance now support appearing as the March 25 swing high at 1324.40 may be the first near-term support level followed by the daily 8-EMA at 1322.07.” Indeed, this area around 1322.07/1324.40 held, exculpatory proof that former resistance has indeed become support, confirming the series of higher highs in the process.
As such, if the near-term exhaustion condition is worked off, then the recent gold price consolidation may be coming to an end as well. With gold volatility rising once more, it seems increasingly likely that the next gold price move will be to the topside; the rally is set to continue.
A break above the 1348.31 high set on June 7 would trigger a bullish breakout, with a measured move up to a new 2019 high at 1376.39. Only a move below 1319.87, recent consolidation support, would nullify the prospective bullish outlook.
IG CLIENT SENTIMENT INDEX: SPOT GOLD PRICE FORECAST (JUNE 13, 2019) (CHART 3)
(Click on image to enlarge)
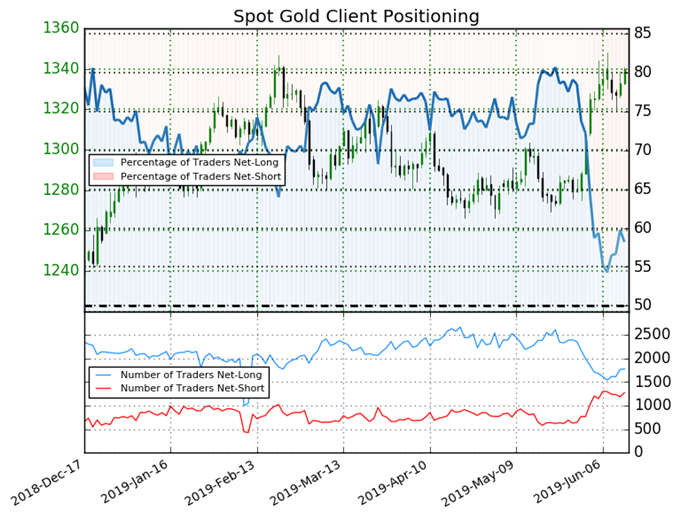
Spot Gold: Retail trader data shows 58.2% of traders are net-long with the ratio of traders long to short at 1.39 to 1. The number of traders net-long is 1.0% higher than yesterday and 2.5% higher from last week, while the number of traders net-short is 4.8% higher than yesterday and 0.4% lower from last week.
We typically take a contrarian view to crowd sentiment, and the fact traders are net-long suggests spot gold prices may continue to fall. Positioning is less net-long than yesterday but more net-long from last week. The combination of current sentiment and recent changes gives us a further mixed spot gold trading bias.


