
Gold Price Pulls Back, XAU Bulls Show At Higher-Low Support
GOLD PRICES PULLBACK FROM FRESH SIX-YEAR-HIGHS
Gold prices have moderated after last week’s breakout. That bullish push showed-up with aggression last Thursday around some confusion in the US Dollar, with Gold bulls pushing the yellow metal up to fresh six-year-highs. The 1450 level was crossed, albeit temporarily, as a wave of USD-weakness showed through a number of markets. Friday morning trade saw that theme pull back, and Gold prices pulled back to find support around the 1421.22 level, which is the 50% marker of the 2012-2015 major move. This level had previously helped to define resistance and so far this same price has helped to hold support through this week’s open.
GOLD PRICE TWO-HOUR CHART
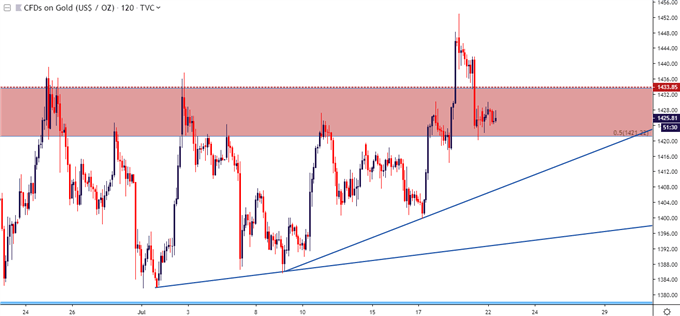
Chart prepared by James Stanley
Taking a step back, and Gold prices are currently exhibiting support at prior resistance. For traders looking to move forward in an aggressive manner, this can keep the door open for bullish strategies with stop potential investigated underneath last Thursday’s swing-low, taken from around the 1414 level on the chart; and if that doesn’t hold, bullish entries could be investigated lower, around the same 1400 level that came into play twice last week as support.
GOLD PRICE EIGHT-HOUR CHART
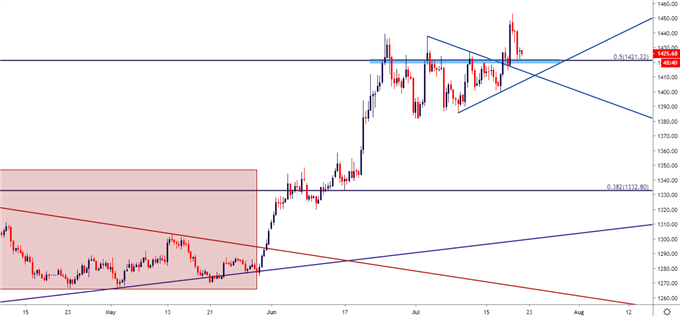
Chart prepared by James Stanley
GOLD PRICES LONGER-TERM
Taking a further step back on the chart, and the zone of resistance that’s currently helping to hold short-term support seems an imposing area on the chart. Despite last week’s push up to fresh six-year-highs, this zone has held weekly resistance for the past four completed weeks, and this is reason enough for bulls to keep risk-controlled on topside continuation strategies. If this zone of resistance does currently restrain the advance, longer-term support could be sought out around 1375 and 1357.50. Above current prices, should that bullish breakout continue, the big area of attraction on the chart is a zone of confluent Fibonacci levels that runs from 1509-1527. Along the way, shorter-term resistance potential exists around 1462 and 1488.
GOLD PRICE WEEKLY CHART
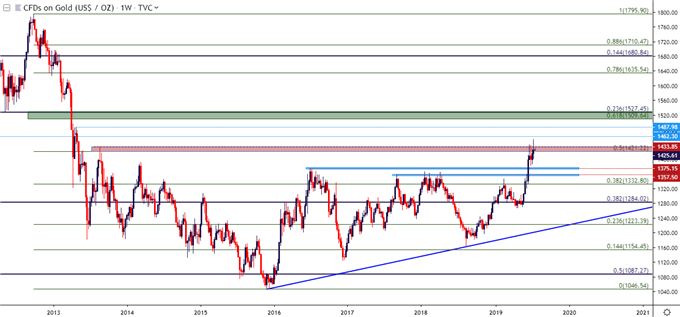
Chart prepared by James Stanley


