
Gold Price Outlook: Rally From Fib Support, Gold Nears ’Danger Zone’
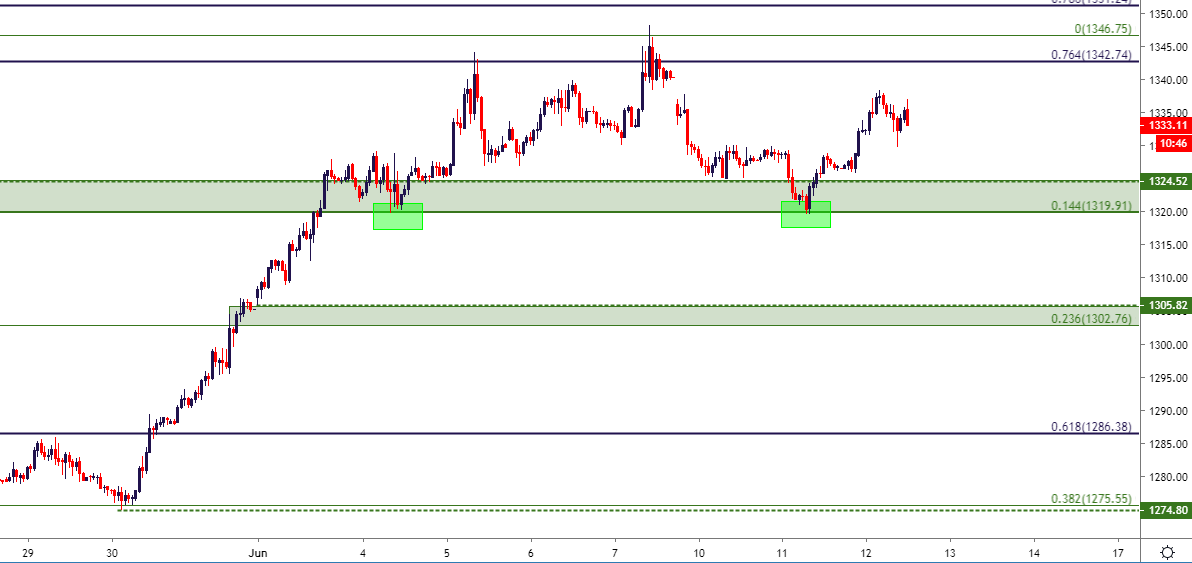
Gold prices are holding near three-month-highs after the bullish ramp began two weeks ago. As discussed last Thursday, the topside ramp in Gold was already getting stretched, but the force shown by buyers up to that point gave little reason to question viability of bullish continuation scenarios. The support level looked at to open the door for bullish scenarios soon came into play, and this is taken from the zone that runs from the 1319.91 Fibonacci level up to the 1324.56 swing-high from March price action.
GOLD PRICE HOURLY CHART
(Click on image to enlarge)
ARE GOLD PRICES NEARING A FRESH FIVE-YEAR-HIGH?
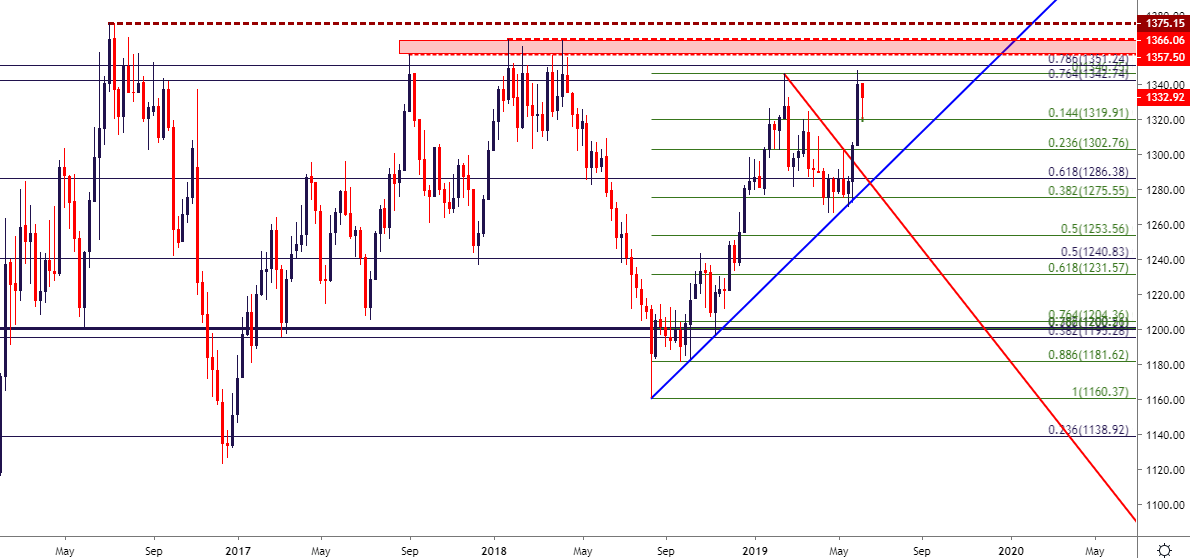
As discussed last Thursday as well as earlier in May with a longer-term look, a big zone of resistance sits atop Gold prices. This area runs from 1357.50 up to 1366.10, and just beyond that is the 2016 high at 1375.15. And while this area has previously proven difficult to break-through for bulls, this scenario should at least be entertained given the current backdrop behind Gold prices. I had looked at ‘bigger picture’ breakout potential as Gold prices were in the midst of consolidation in May, and our own Rich Dvorak pointed out the shifting backdrop behind Gold volatility a day before this current breakout began. At 3 PM on May 29th, Rich published the article entitled, Gold & US Dollar Threaten Breakout as Rate Volatility Spikes. Twelve hours later Gold prices had run into support; and a week after that, Gold prices had moved up by almost a full $70.
GOLD PRICE WEEKLY CHART: WEDGE BREAKOUT PROPELLED INTO RESISTANCE
(Click on image to enlarge)
GOLD PRICE STRATEGY MOVING FORWARD
The primary challenge around bullish approaches at the moment is proximity to recent support. With Gold prices having rallied so far from yesterday’s lows, traders may have a difficult time justifying the risk required for bullish trend strategies.
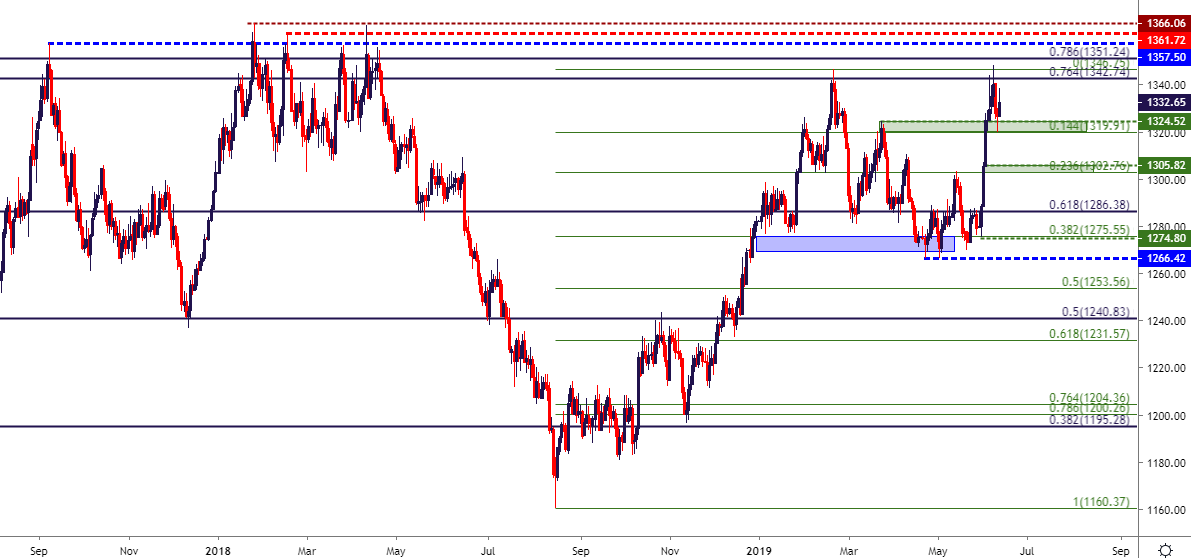
This can keep the door open for topside breakout strategies, looking for breaches of resistance to lead into a test of the next resistance level on the chart. Below, I look into a number of potential resistance levels currently sitting atop price action that could be utilized for such an approach. Prior points of interest exist at 1346.75, 1351.24, 1357.50, 1361.72 and 1366.06.
GOLD PRICE DAILY CHART
(Click on image to enlarge)
Outside of that, traders may be able to use shorter-term dynamics to work-in to the long side of Gold prices; looking at near-term support around the 1330 handle. A hold of support here could keep the door open for short-term trend strategies, targeting a return to the 1342 and 1346 Fibonacci levels. If those targets come into play in short-order, break-even stops could be incorporated to look for further breakout potential.
GOLD PRICE HOURLY CHART
(Click on image to enlarge)
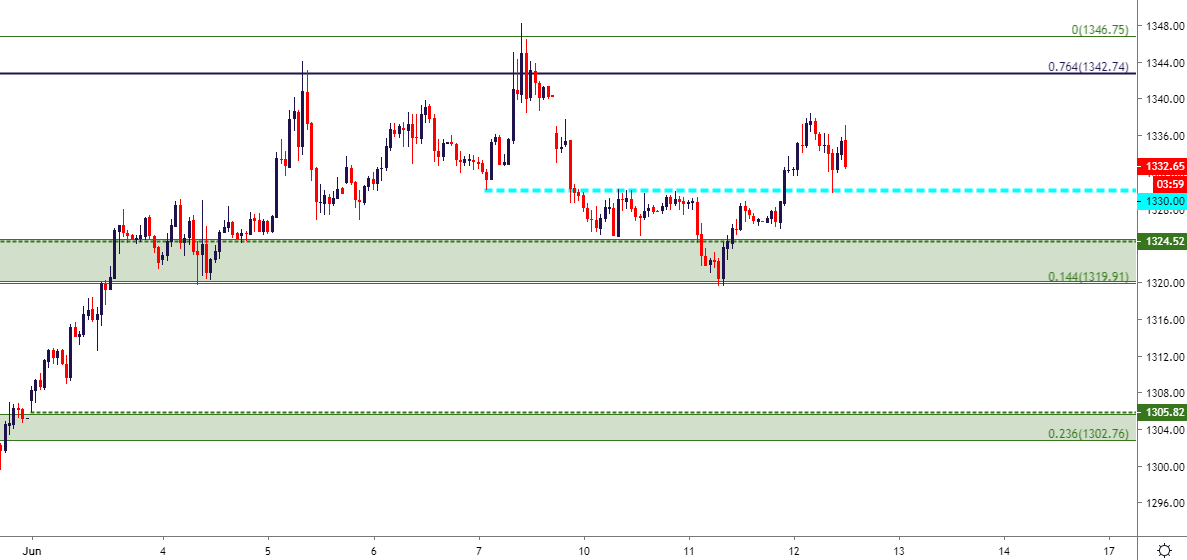
Chart prepared by James Stanley


