
Gold Price Outlook Mired By Failure To Test 50-Day SMA

Gold outperforms its precious metal counterparts as the price of copper tumbles to a fresh yearly low ($3.72), and it remains to be seen if bullion will move to the beat of its own drum as it still retains the advance following the Federal Reserve interest rate decision.
As a result, the price of gold may continue to track the June range amid the ongoing pullback in US Treasury yields, and the threat of looming recession may encourage the Federal Open Market Committee (FOMC) to retain the current course for monetary policy as Chairman Jerome Powell warns that it will be “very challenging” to foster a soft-landing for the US economy.
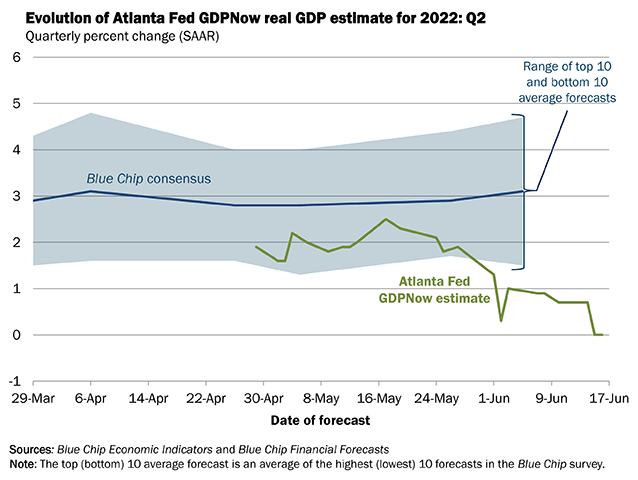
Source: Atlanta Fed
In fact, the Atlanta Fed GDPNow model now shows that the forecast for “real GDP growth (seasonally adjusted annual rate) in the second quarter of 2022 is 0.0 percent,” and signs of a slowing economy may force Fed officials to tame speculation for a 100bp rate hike amid the growing threat of a recession.
In turn, a further pullback in US yield may keep the price of gold afloat ahead of the next FOMC interest rate decision on July 27 as the weakening outlook for growth limits the central bank’s scope to implement a restrictive policy, and it seems as though the committee will retain the current approach in normalizing monetary policy as Chairman Powell and Co. “strive to avoid adding uncertainty in what is already an extraordinarily challenging and uncertain time.”
With that said, the price of gold may continue to outperform its major counterparts as it holds above the May low ($1787), but lack of momentum to test the 50-Day SMA ($1864) may undermine the rebound from the monthly low ($1805) as the moving average reflects a negative slope.
GOLD PRICE DAILY CHART
(Click on image to enlarge)
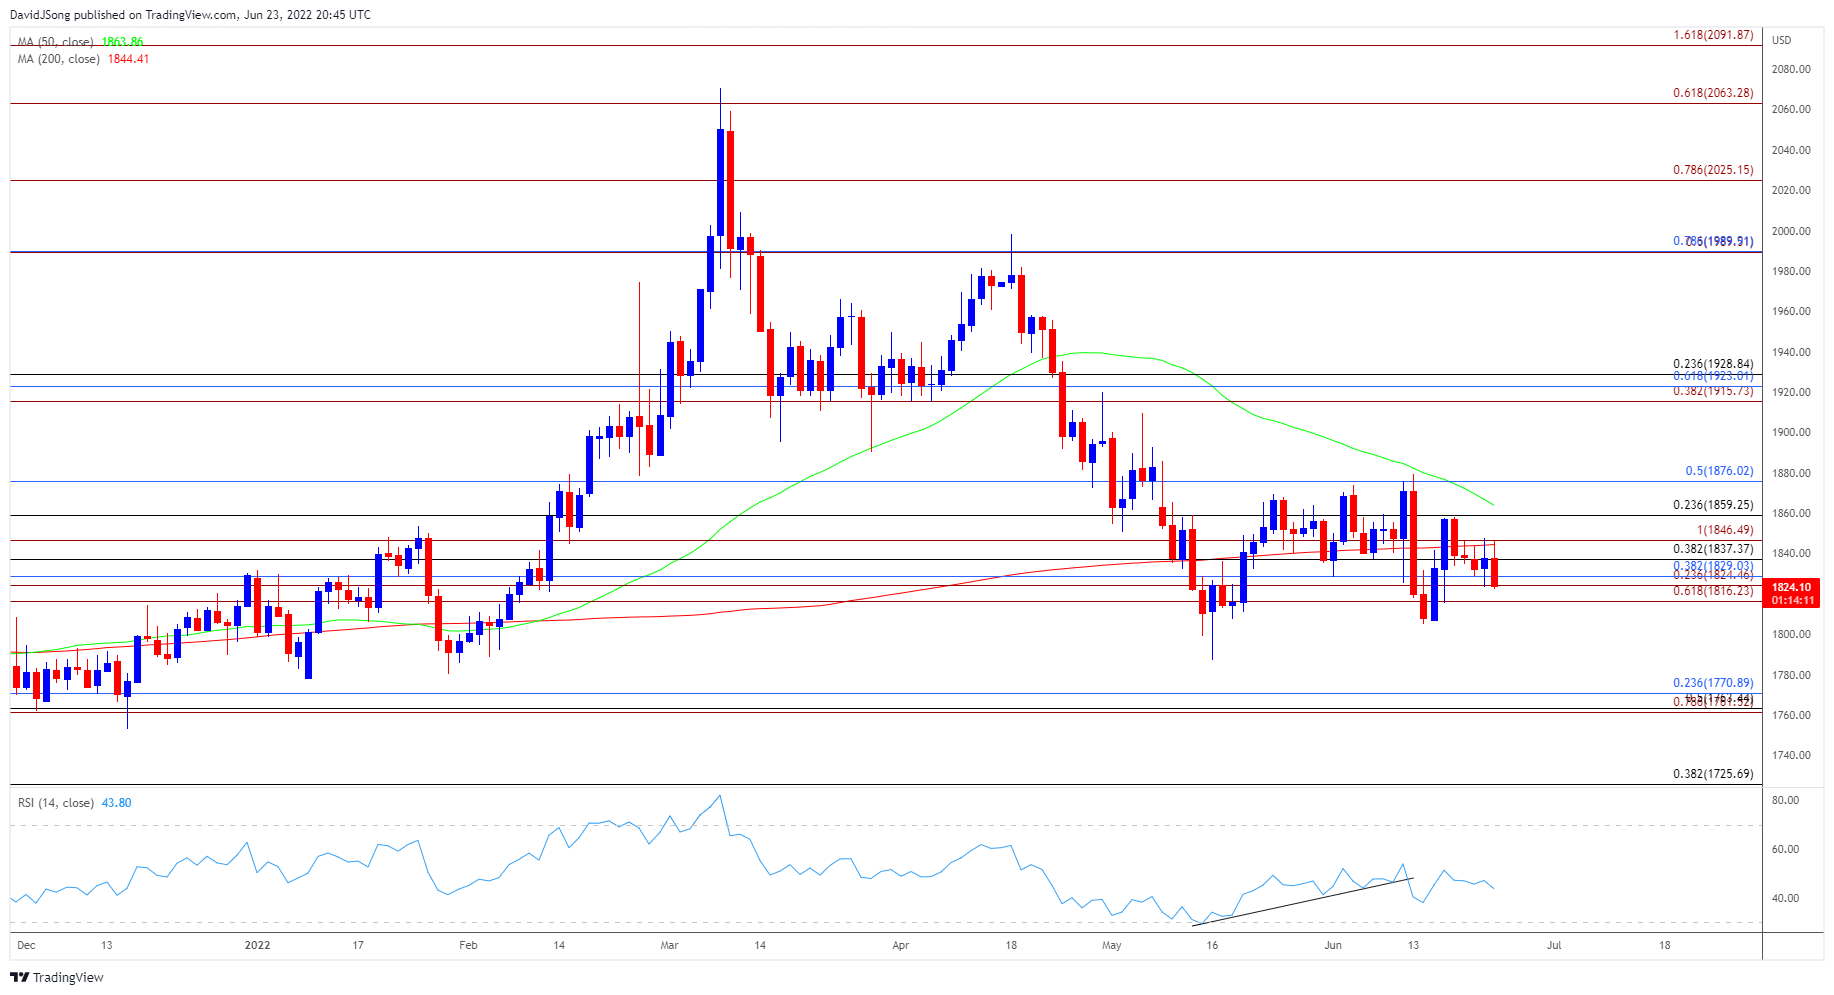
Source: Trading View
- The price of gold appeared to be on track to test the 50-Day SMA ($1864) after failing to test the May low ($1787), but the precious metal appears to be stuck in a narrow range as it struggled to break/close above the $1859 (23.6% retracement) region.
- Lack of momentum to test the moving average may undermine the rebound from the monthly low ($1805) as the indicator reflects a negative slope, with the Relative Strength Index (RSI) highlighting a similar dynamic as it snaps the upward trend carried over from the previous month.
- A close below the $1825 (23.6% expansion) to $1829 (38.2% retracement) region brings the $1816 (61.8% expansion) area on the radar, with a move below the monthly low ($1805) raising the scope for a test of the May low ($1787).
Disclosure: See the full disclosure for DailyFX here.


