
Gold Price Outlook: Gold Snaps Back From Highs, Support In Sight
GOLD PRICES RUN INTO RESISTANCE
The bullish trend in Gold has finally found some resistance that could hold buyers at bay, putting at least a pause on what’s become an aggressively strong month of price action in the yellow metal. Gold prices spent much of the prior three months in consolidation; highlighting breakout potential in early-May and again later in the month. That allowed for an aggressive breakout to take place that saw Gold prices surge up to fresh six-year-highs, setting a fresh high watermark during yesterday’s trade just shy of the 1440 handle.
Resistance is playing in off of a longer-term zone that connects the 50% marker of the 2012-2015 major move to the prior six-year-high at 1433.85.
GOLD WEEKLY PRICE CHART
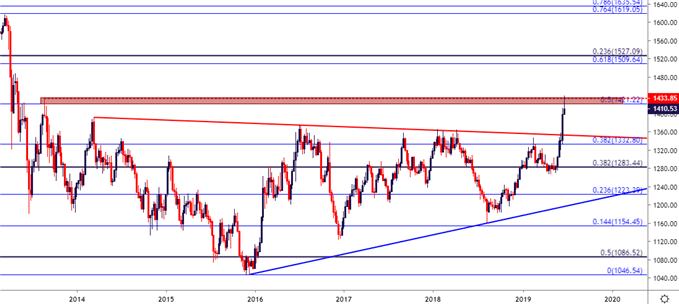
Chart prepared by James Stanley
Going down to the daily chart highlights bearish reversal potential. Gold prices put in a day of indecision during yesterday’s trade after that fresh-high came into play. With sellers making a run as follow-up to yesterday’s indecision, the potential is there for the build of an evening star pattern. Such a formation will often be approached with the aim of a bearish reversal, particularly when a prior top-side trend had moved into overbought status. That happened weeks ago in Gold but buyers continued to push; making this an item of interest for traders on either side of Gold prices. For those looking at short-side stances, completion of this formation may open the door for a larger reversal. For those continuing to employ bullish strategies, letting this pullback play-out until support might come into play could re-open the door for bullish continuation strategies.
GOLD PRICE DAILY CHART
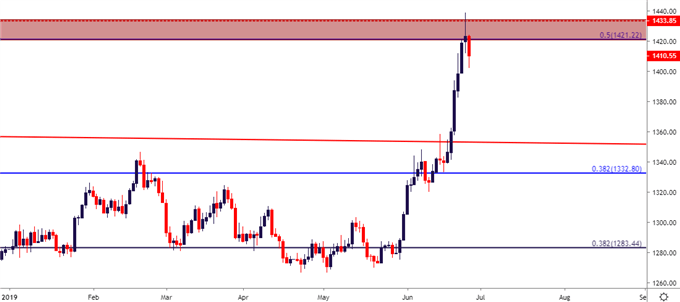
Chart prepared by James Stanley
GOLD PRICE NEXT SUPPORT POTENTIAL
There are a variety of levels underneath current prices that can function as either targets for short-side approaches or support potential for those looking to get long. Given how stretched that prior move had become, finding recent historical levels of note could be of a challenge. But, the 2014 swing-high at 1392 could function as such, and a bit lower at 1375.15 is the 2016 swing-high, and this is confluent with the 38.2% Fibonacci retracement of the most recent advance.
Below that, another confluent zone of interest shows around the 1350-level, as there’s both the 50% marker of the recent trend to go along with a prior swing-high that showed around the bearish trend-line projection of the longer-term symmetrical wedge pattern. If price action poses a break below that zone in short-order, then something in the backdrop has likely shifted and the bullish approach will likely need to come into question.
For bulls that want to remain aggressive – watch the 1400 level today, as this is the 23.6% retracement of that recent major move; and if buyers can hold the line of support here, the bullish theme remains in full view.
GOLD PRICE FOUR-HOUR CHART
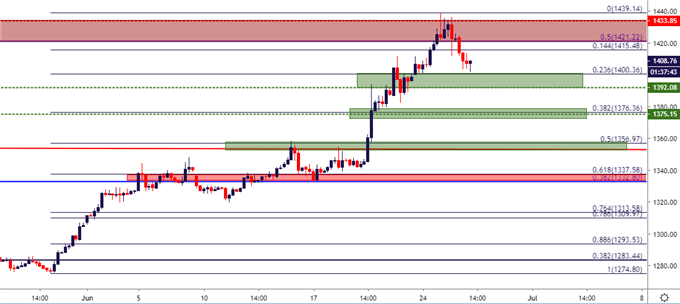
Chart prepared by James Stanley


