
Gold Price Outlook: Gold Breaches Trend-Line, Yearly Low Exposed
GOLD PRICES BREACH BULLISH TREND-LINE AS RISK AVERSION TAKES A PAUSE
Gold prices are back on the offer after an early-month flare of strength has fallen flat. Gold prices limped into the month of May following a rough two-and-a-half month stretch. In mid-February, a large pullback showed-up that took prices from a high of 1346.75 all the way down to a support zone that runs from 1275-1280. That support helped to hold the low in the opening days of March, and the ensuing bounce saw the build of a lower-high, taken from around the 1325 level. Another return to support in early-April showed a similar theme, as a lower-high developed on the corresponding bounce, and sellers were soon in the driver seat, pushing Gold prices down to a fresh 2019 low in the opening days of May.
Gold prices soon found support on a bullish trend-line. This trend-line can be found by connecting the August-November swing lows from last year, and the projection of this line helped to arrest the declines in early-May. And as looked at a couple of weeks ago, a series of shorter-term higher-lows that built after that support inflection opened the door for a bullish response.
GOLD PRICE EIGHT-HOUR CHART
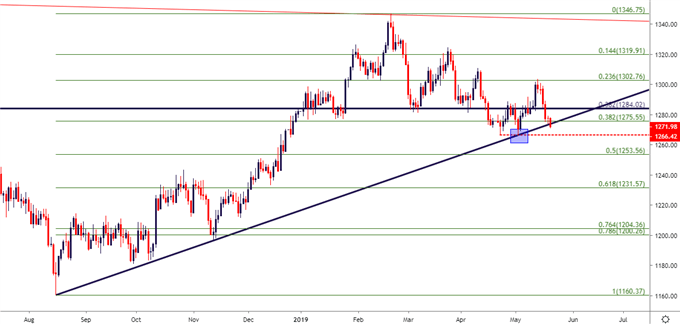
Chart prepared by James Stanley
Gold prices ran into resistance on Monday evening last week, taken from the 1302.76 level, which is the 23.6% retracement of the August 2018 – February 2019 major move. And as risk aversion continued to pull back, as indicated by strength in US equities following last week’s gap-lower, Gold prices soon returned back down to that key support zone, hold around the 1275 level into the close of last week.
This week has thus far seen continued weakness, and sellers have now pushed Gold prices below the bullish trend-line that’s held the lows for the past nine months. This exposes a double bottom at 1266.10, which is currently functioning as the 2019 low in Gold.
GOLD PRICE FOUR-HOUR CHART
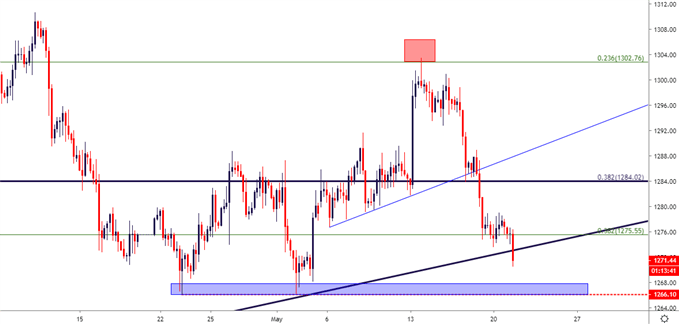
Chart prepared by James Stanley
GOLD PRICES CARRY BREAKDOWN POTENTIAL
Below current price action is a confluent zone of interest that shows around the 1253 level. The price of 1253.56 is the 50% retracement of the same major move that offered resistance at the 23.6% level and support at the 38.2% marker during last week’s trade. But just below that, at 1252.90, is the 76.4% retracement of the 2011-2015 major move.
GOLD PRICE DAILY CHART
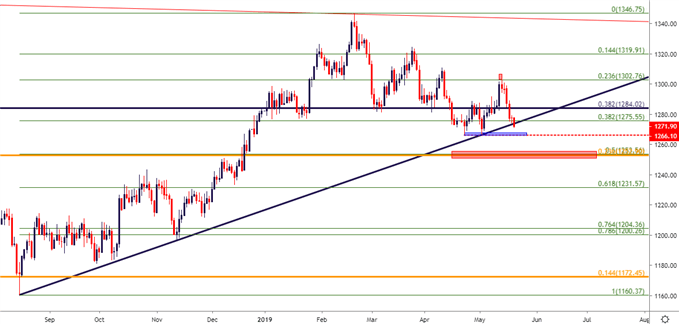
Chart prepared by James Stanley
RETAIL TRADERS BETTING ON A BOUNCE – KEEPING FOCUS ON BEARISH THEMES
At this point, retail traders are heavily anticipating a bounce in Gold prices, and this could make the short-side theme that much more attractive. Approximately 79.5% of retail traders in the IGCS sample are holding net-long exposure, amounting to a ratio of 3.87-to-1. This further highlights the bearish potential in the yellow metal as, at some point, as at least some of these traders are likely nearing capitulation with fresh lows coming into play. There are likely a number of stops sitting just below 1266.10, and if that price is taken-out, those sitting orders could further propel prices-lower.
GOLD PRICE IG CLIENT SENTIMENT
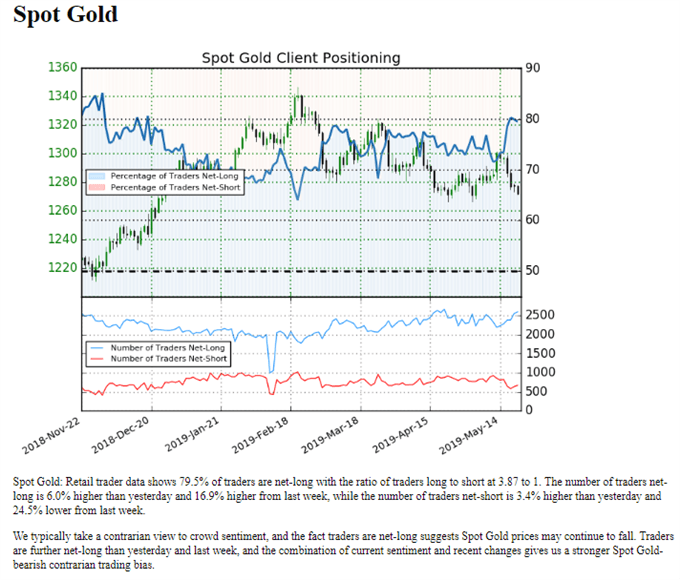
Chart prepared by James Stanley


