
Gold Price Holds Steady As Fed Balance Sheet Approaches June Peak
Gold price talking points
The price of gold trades in a narrow range after slipping below the 50-Day SMA ($1943) for the first time since June, and the break of the August low ($1863) may indicate a potential change in market behavior as the Relative Strength Index (RSI) sits at its lowest level since March.
Gold price holds steady as Fed balance sheet approaches June peak
The price of gold holds near the monthly low ($1849) as the Federal Reserve’s balance sheet widens for the second week to reach its highest level since June, but it seems as though the precious metal will no longer trade to fresh yearly highs during every month in 2020 as the update to the Summary of Economic Projections (SEP) shows the longer run interest rate forecast unchanged from the June meeting.
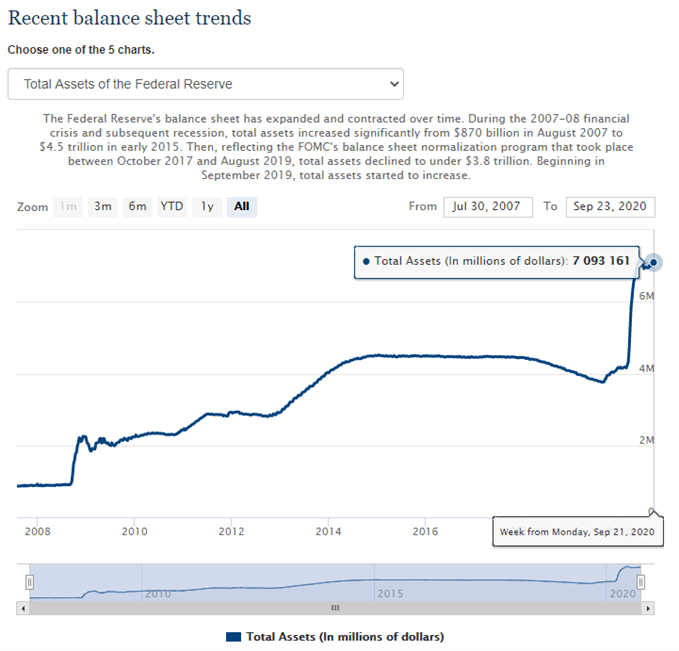
Source: FOMC
It seems as though the Federal Open Market Committee (FOMC) will rely on its current tools to support the US economy despite plans to “achieve inflation that averages 2 percent over time,” and waning speculation for additional monetary support may keep the price of gold under pressure as the pullback from the record high ($2075) largely tracks the correction in global equity prices.
Looking ahead, the FOMC appears to be on track to retain the current policy at the next interest rate decision on November 5 as the central bank vows to “increase its holdings of Treasury securities and agency mortgage-backed securities at least at the current pace,” and the it remains to be seen if more of the same from Fed officials will continue to drag on investor confidence as Chairman Jerome Powell tells US lawmakers that the committee remains “committed to using our tools to do what we can, for as long as it takes, to ensure that the recovery will be as strong as possible.”
Until then, swings in risk appetite may continue to sway the price of gold as the precious metal appears to be broadly tracking the change in global equity prices, and the pullback from the record high ($2075) may turn out to be an exhaustion in the bullish trend rather than a change in market behavior as the crowding behavior in the US Dollar largely persists.

The IG Client Sentiment report continues to show retail traders net-long USD/CHF, USD/JPY and USD/CAD, while the crowd remains net-short AUD/USD, EUR/USD, and NZD/USD. GBP/USD has bucked the trend as positioning flips for a second time this month, with 55.51% of traders current net-long the pair as the ratio of traders long to short stands at 1.25 to 1.
Nevertheless, it seems as though the broad based net-long US Dollar exposure will carry into October even though the FOMC retains a dovish forward guidance for monetary policy, and the low interest rate environment along with the ballooning central bank balance sheet may continue to heighten the appeal of gold as an alternative to fiat-currencies as current market trends remain in place.
With that said, the 50-Day SMA ($1943) may continue to track the positive slope from earlier this year, but the technical outlookis clouded with mixed signals asthe price of gold takes out the August low ($1863), while the Relative Strength Index (RSI) sits at its lowest level since March.
Disclosure: See the full disclosure for DailyFX here.


