
Gold Price Forecast: XAU/USD Surges Up To Fibonacci Resistance
It’s been a fast start to the year, particularly in Bitcoin and Gold: Gold prices have wasted no time in breaking out to begin 2021 trade. This comes after a particularly disjointed final four months of last year in Gold. The yellow metal put in a strong breakout from June-August, eventually hitting a fresh two-year-high at the 2075 level. But, after setting that top on August 7th, buyers went on hiatus as the pair then spent the next four months in varying forms of digestion.
Bulls got back on the bid in December but through the end of the month, that bullish theme still had a look of correction as prices had merely found resistance around the 1900 level, keeping the door open for a continuation of lower-lows and lower-highs. But the first full trading day of 2021 has seen that topside theme take over again, as Gold prices have broken out above both 1900 and 1920, eventually finding resistance at 1943.41, which is the 14.4% Fibonacci retracement of the 2018-2020 major move (shown in blue on the below chart).
GOLD FOUR-HOUR PRICE CHART
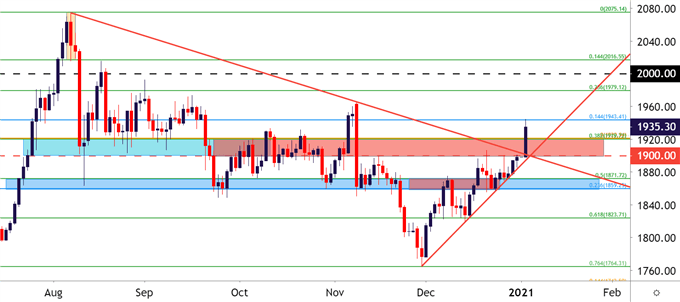
Chart prepared by James Stanley; Gold on Tradingview
At this point, bulls have a couple of key areas to follow for higher-low support if looking for continuation of this recent trend. The prior resistances at 1900 and 1920 could be particularly attractive for such a theme, as the former of those prices had helped to set resistance into the New Year and the latter functioned as the all-time-high for almost nine full years.
Taking a shorter-term look at the matter on the below four-hour chart, and that near-term bullish trend comes into greater focus. The 1920 level gains perhaps even greater attraction as there’s also a 38.2% Fibonacci retracement near that price. The 38.2% retracement from the June-August major move resides at 1919.72, adding a bit of confluent to this price; and below that the 1900 psychological level comes back into the picture.
GOLD FOUR-HOUR PRICE CHART
(Click on image to enlarge)
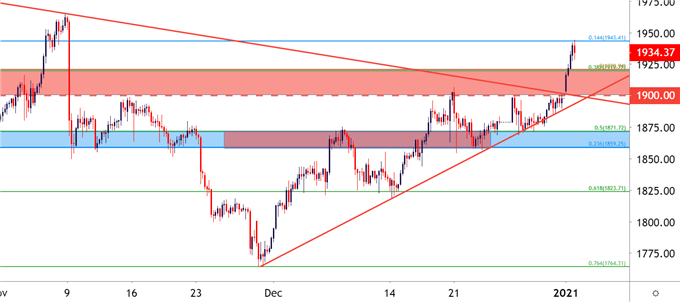
Chart prepared by James Stanley; Gold on Tradingview
Taking a step back on the chart and a series of additional levels come into view. If bulls are able to retain control of this Gold breakout in early-2021 trade, the next big levels of potential resistance may show around 1965, which is the current three-month-high; followed by 1979 which is the 23.6% Fibonacci retracement of the same June-August major move. If those levels are traded through, the $2,000 psychological level would be next, followed by 2016.55 and then that 2075 all-time-high.
On the underside of price action, the same support/resistance zone looked at in December, spanning from Fibonacci levels at 1859-1871, could come into play should 1900 get taken-out. Below that, a Fibonacci level at 1823 presents some potential for subordinated support.
GOLD DAILY PRICE CHART
(Click on image to enlarge)
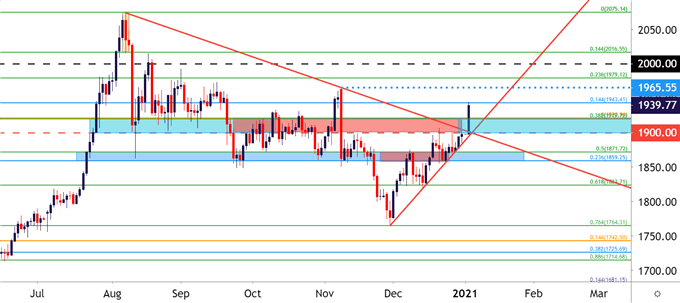
Chart prepared by James Stanley; Gold on Tradingview
Disclosure: See the full disclosure for DailyFX here.


