
Gold Price Forecast: XAU/USD Pulls Back To Resistance After Break Down
Last week brought a quick rush of selling into Gold prices that helped to set a fresh two-month-low. This was accompanied by a theme of USD-strength even as the risk-on move drove asset prices in many major markets. Gold, and Silver to a lesser extent, were noticeably absent from that risk-on participation. Friday brought a reprieve, helped along by some softening in the USD, and Gold bulls have continued that late-week bounce so far into the start of the early week.
The big question here is whether this is just a pullback re-loading for another wave of bearish price action; or whether that test below 1800 marked some type of capitulation from Gold bears.
GOLD DAILY PRICE CHART
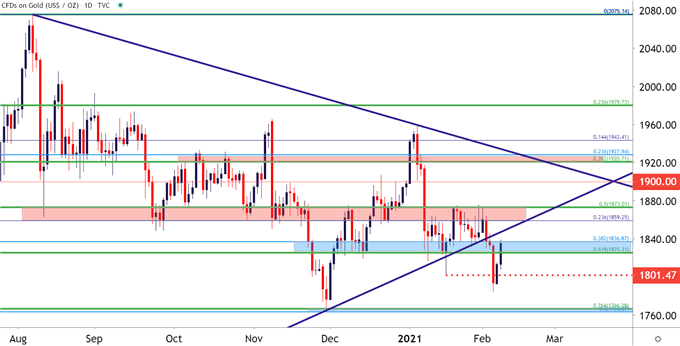
Chart prepared by James Stanley; Gold on Tradingview
The current zone of resistance comes from an interesting spot on the chart that’s previously helped to set some support in mid-December of last year, and then again in mid-January of this year. This zone runs from 1825.31-1836.87 and is comprised of two different Fibonacci retracement levels from two different major moves. The latter of those prices is the 38.2% retracement of the March-August major move; while the former of those levels is the 61.8% retracement of the June-August major move.
GOLD DAILY PRICE CHART
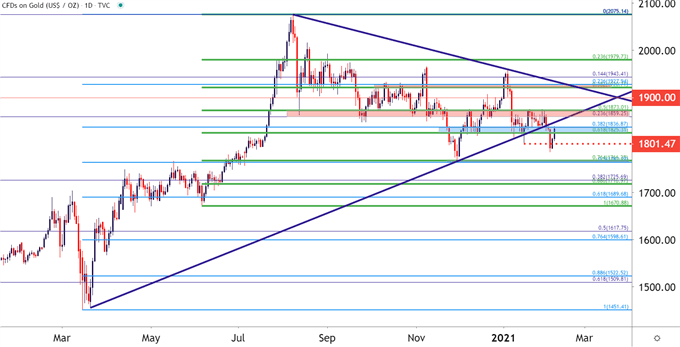
Chart prepared by James Stanley; Gold on Tradingview
GOLD MOVING FORWARD – TRACKING THE USD
At this point, the inverse correlation between Gold and the US Dollar appears to be back in order, shown on the lower-portion of the below chart. And given that the US Dollar has so far spent much of the year in a counter-trend fashion, it appears as though a big driver on Gold is going to be USD performance.
GOLD DAILY PRICE CHART WITH USD CORRELATION APPLIED
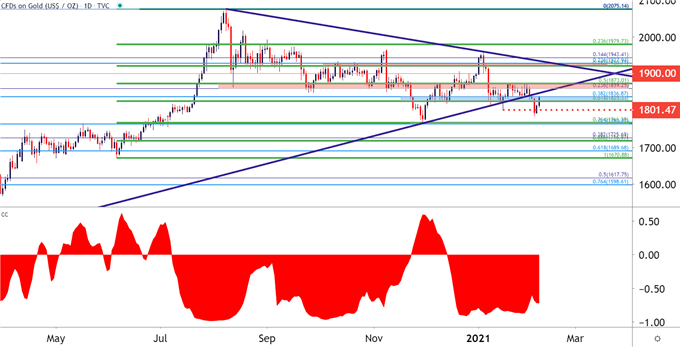
Chart prepared by James Stanley; Gold on Tradingview
At this stage, the US Dollar has pulled back to test trendline support from prior resistance. A hold here can keep the door open for a deeper breakdown in Gold, punctuated by the lower-high resistance at prior support following the breakdown from the symmetrical triangle pattern.
But if USD bears come back with gusto, similar to what was seen in the back eight months of last year, Gold prices could surprise to the upside, and given the recent test below 1800, logically speaking, at least some of those older positions with stops adjusted to or around psychological levels will be out of the market.
US DOLLAR FOUR-HOUR PRICE CHART
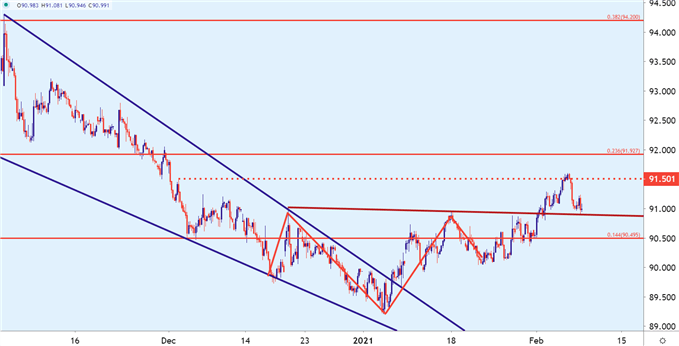
Chart prepared by James Stanley; USD, DXY on Tradingview
Disclosure: See the full disclosure for DailyFX here.


