Gold Price Forecast: XAU Coil Continues After 1800 Res Rejection

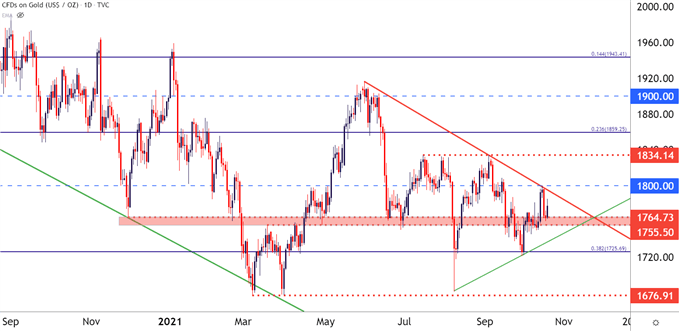
Gold prices have retreated back to support and are catching a mild bounce this morning. The support zone in question has become somewhat of a sticking point this year as the zone running from 1755-1764 has elicited multiple support reactions. Most recently, this zone helped to hold the lows last week before buyers pushed for a resistance test at the 1800 handle. That test failed with prices quickly retreating back to support, and this confirmed a bearish trendline that can be found by connecting June and September swing-highs, shown in red on the below chart.
GOLD DAILY PRICE CHART

Chart prepared by James Stanley; Gold on Tradingview
GOLD LONGER-TERM: TUG-OF-WAR
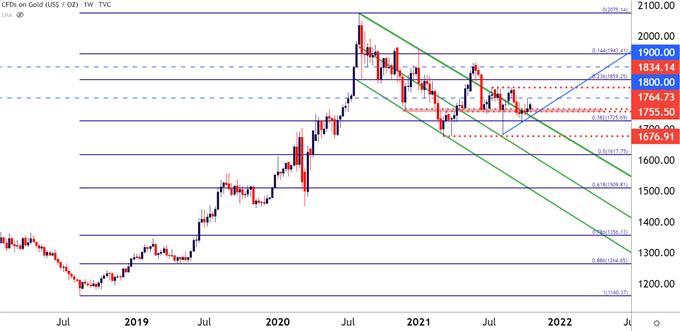
Taking a step back on the Gold chart and there remains a bullish scenario. The bull flag that’s been brewing for the past few years does remain in-play and has yet to be nullified; but its now been more than a year since the metal has set a fresh high, leading to some rightful questioning of that bigger picture bullish theme.
At this point, the 38.2% Fibonacci retracement can be looked to as a meter of the long-term move, and so far, buyers have held price above this price for the past two months after a third failed test to break down below the 1680 level. The Fibonacci level itself is plotted at 1725.69, and price action remaining above this price can keep the door open to longer-term bullish scenarios, but the matter of motivation remains a concern at this point.
GOLD WEEKLY PRICE CHART

Chart prepared by James Stanley; Gold on Tradingview
GOLD: MESHING SHORT AND LONG-TERM VANTAGE POINTS
Combining the two above themes, we essentially are looking at near-term digestion while the long-term look continues to carry some bullish potential. That bullish potential isn’t new, however, and buyers have had ample opportunity to push prices higher but as yet, they haven’t.
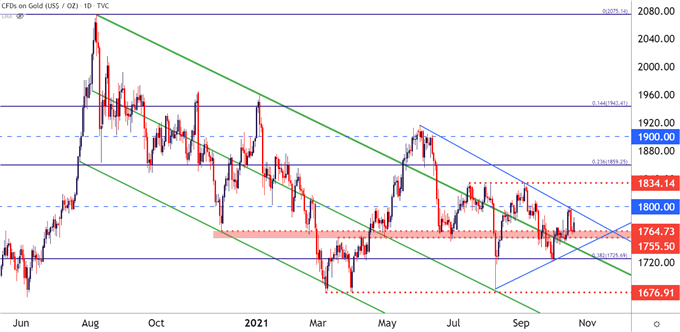
Near-term, there’s a symmetrical triangle that’s built with the recent higher-lows and lower-highs. And this runs alongside the longer-term bull flag formation, and there’s some well-defined levels nearby, as well. But traders can look to work with resolution of the near-term symmetrical triangle formation to direct how they should incorporate the longer-term look.
This opens the door for a symmetrical triangle break for breakout continuation potential, with focus on the 1800 handle for bullish scenarios and 1725.69 for bearish scenarios. If the 1800 level is taken-out, the big level sitting above is 1834, which has elicited three separate resistance responses since July. On the underside of price action, a breach of the 1725.69 level opens the door for a move down towards the 2021 low, around the 1680 handle.
GOLD DAILY PRICE CHART

Chart prepared by James Stanley; Gold on Tradingview
Disclaimer: See the full disclosure for DailyFX here.


