
Gold Price Forecast: Who’s Up For A Sell Trade Below 50 EMA At $1,792?
Gold prices were closed at $1795.95 after reaching a high of $1808.45 and a low of $1791.75. Gold turned red on Wednesday after rising for two consecutive sessions, despite the prevailing weakness in the US dollar. On Thursday, the gold price forecast remained bearish below the 1,793 resistance level, which the 50 EMA is extending.

Image Source: Pixabay
The US Dollar Index (DXY), which measures the greenback’s value against a basket of six major currencies, dropped to 92.42 and lost all of its previous daily gains. While 10-year Treasury yields on 10-year notes rose for the day to 1.32%, the US dollar gained some support while gold prices fell.
The precious metal fell below the $1800 level on Wednesday after US Treasury yields increased by more than 2.1% in a single day, raising the opportunity cost for investors holding non-yielding bullion and increasing selling pressure on the yellow metal.
Quick Update On Economic Events
The recent spike in Treasury yields could be attributed to the strong Empire State survey that suggested that the growth in the manufacturing sector might not be as weak as initially anticipated. This report came in after the Fed reported that industrial production grew slower by 0.4% in August compared to the expansion in July by 0.8%. Some analysts suggested that the recent decline in industrial production was due to the factory outages forced by Hurricane Ida that disrupted the output.
At 17:30 GMT, the Empire State Manufacturing Index for September surged to 34.3 against the projected 18.1 and supported the US dollar, which added to further losses in gold prices. The import prices from August declined by 0.3% against the predicted 0.3% and weighed on the US dollar, which caused a further decline in gold prices.
At 18:15 GMT, industrial production from August dropped by 0.4% against the forecasted 0.5% and weighed on the US dollar, limiting the yellow metal’s downfall. The Capacity Utilization Rate in August remained flat at 76.4%, as expected.
Meanwhile, US consumer prices increased at their slowest pace in six months in August, which backed the Fed’s initial views that high inflation levels were transitory. The data also revealed that the Fed might go slow on reducing economic support measures and keep interest rates near zero for some time.
Census Bureau To Report Retail Sales And Core Retail Sales
The US retail sales and core retail sales will remain in highlights from the Census Bureau. Economists expect a drop until -0.1% and -0.7% in retail and core retail sales this month. Furthermore, the focus of investors has now shifted towards the upcoming two-day monetary policy meeting next week. Investors await the meeting to find some clues about tapering, which has been weighing on the market.
(Click on image to enlarge)
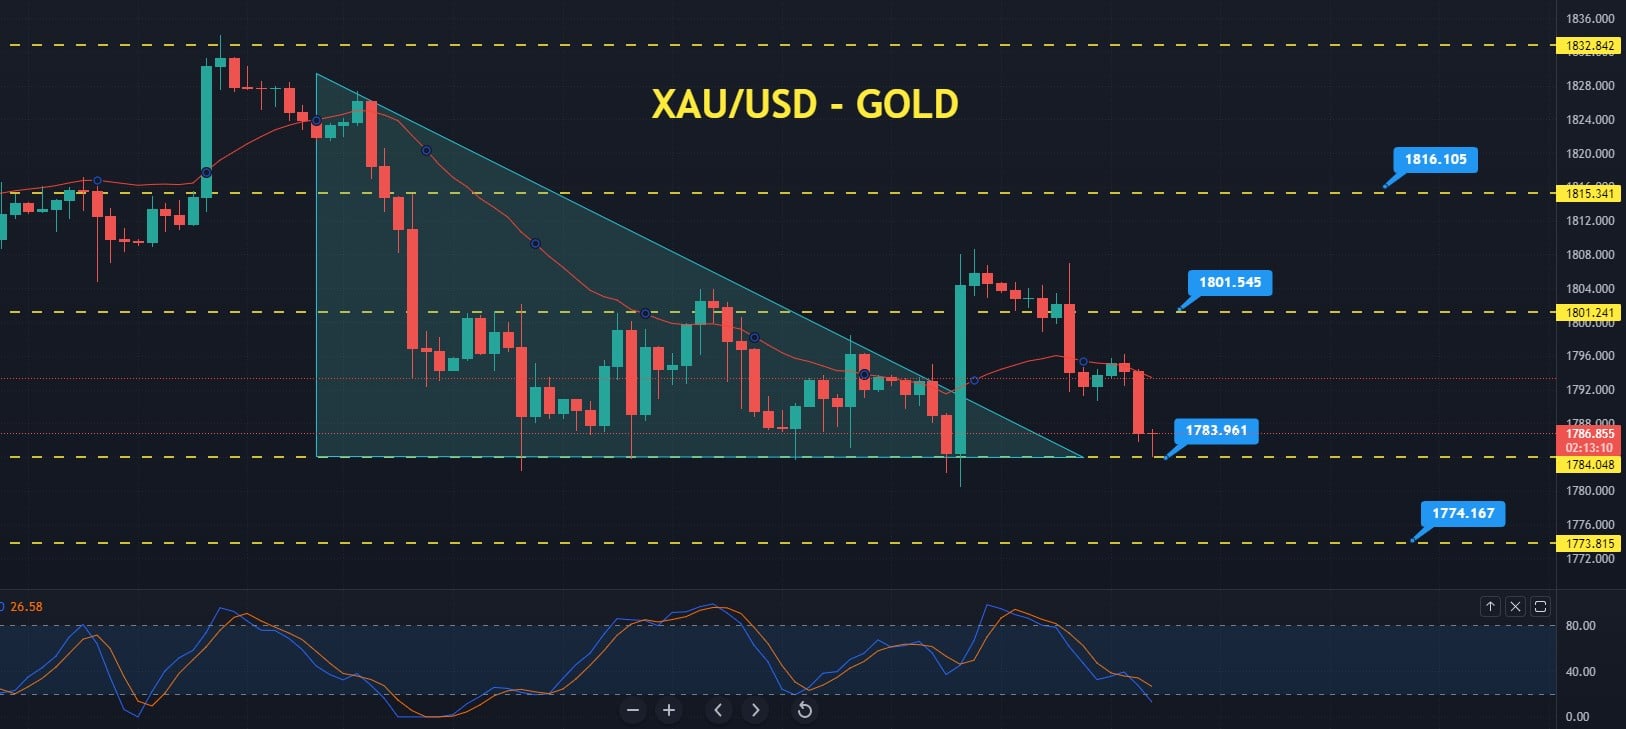
Gold 4-Hour Timeframe
Gold Price Forecast – Daily Support And Resistance
- Support Resistance
- 1788.99 1805.69
- 1782.02 1815.42
- 1772.29 1822.39
- Pivot Point: 1798.72
Gold Price Forecast – 50 EMA To Extend Resistance At 1,792
On Thursday, the gold price forecast remains bearish below the 1,793 resistance level, which 50 EMA is extending. The closing of candles below this level supports a selling bias in the precious metal gold. On the 4-hour timeframe, the precious metal gold has formed the “Three Black Crows pattern” that’s likely to drive a sharp selling trend in gold.
Moreover, gold faces immediate resistance at the 1,793 level, which is being extended by 50 periods exponential moving average. A breakout of the 1,793 level will likely open a buying trend until the next resistance level of 1,801. An additional break out of the 1,801 level can expose gold prices towards the next resistance level of the 1,815 level.
In contrast, gold may find immediate support at a triple bottom level of 1,783. However, a bearish breakout below this level could extend the selling trend until the following support levels of 1,774 and 1,765.
Furthermore, the leading indicator, Stochastic RSI, remains below 50, indicating a strong gold-selling trend. Therefore, Forex trading market participants may sell below the $1,792 level to target the $1,783 and $1,774 levels. Alternatively, traders can take a buy position above the $1,774 level today. All the best!
Disclaimer: Foreign exchange (Forex) trading carries a high level of risk and may not be suitable for all investors. The risk grows as the leverage is higher. Investment objectives, risk ...
more

