
Gold Price Forecast: Gold Jumps, Bear Market Bounce Or Something More?
While many risk assets have enjoyed a strong start to the year, with even some micro or small cap stocks being bid ‘to the moon,’ it’s been a really rough year for Gold bulls. This is in stark contrast to last year when the Fed’s fast money-printing initiatives helped to support the bid in Gold as buyers drove prices up to a fresh all-time-high in August of last year.
But tonality can change very quickly in markets, especially when stimulus is involved; and after Gold prices put in a bearish engulfing candlestick on the Daily chart, often approached with the aim of bearish continuation, things have just not been the same. Gold prices have yet to re-engage with that prior high at 2075. And what initially looked like a pullback has turned into so much more as there’ve been legitimate bearish reversal tendencies throughout this recent move. Key of which was reaction to positive news items – like the big bearish bar that Gold had printed on November 9th, the day that we learned of vaccines nearing ready.
Last week saw another big test when Gold prices moved-in for a test of the 38.2% Fibonacci retracement of the 2018-2020 major move. This is a noteworthy move as this is when the bullish cycle in Gold restarted – fresh on the heels of Jerome Powell’s comments in the opening days of Q4, 2018 in which he said that the neutral rate was ‘a long way off.’ Well – the Fed did hike after that comment but they quickly shifted stances coming into 2019, going back into a cutting cycle, and this helped to support the bid in Gold. So the 38.2% retracement of that move is important for trend continuation purposes if that bullish cycle is to continue.
GOLD WEEKLY PRICE CHART
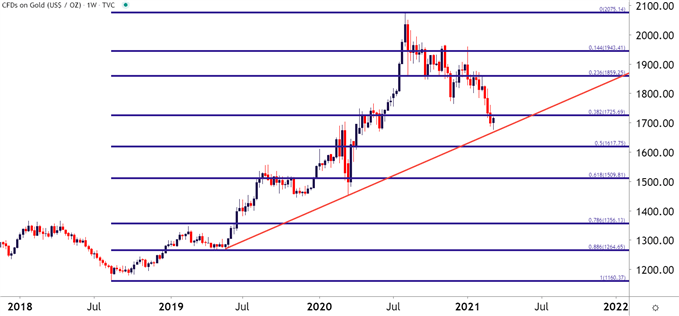
Chart prepared by James Stanley; Gold on Tradingview
Given some greater granularity with short-term Gold prices, and there is some additional context to work with. On the below Daily chart, Fibonacci retracements have been added to two different shorter-term major moves.
On the below chart, the major move spanning from March-August has been outlined in Red and the shorter-term move from the June lows up to that August high have been plotted in Green. Collectively, this can offer some areas of confluence that highlight strategy components that could be usable in the days/weeks ahead, and will be looked at in greater depth a little lower in this article.
GOLD DAILY PRICE CHART
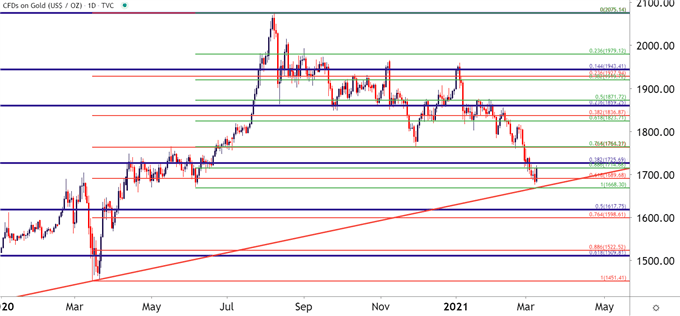
Chart prepared by James Stanley; Gold on Tradingview
On the hourly chart below, some strategy parameters begin to show themselves. Prices have just pushed into a resistance zone that’s already held multiple inflections over the past couple of weeks, first as support and then through multiple iterations last week – as resistance. The key area here is that 1725.69 level, which is the 38.2% retracement of the 2018-2020 major move. A break-above that could possibly open the door to bullish trend strategies but – until then – this looks to be a corrective move.
If buyers can push beyond 1725.69, look for a big test in the 1759-1766 area, as there’s a number of items there including a couple of Fibonacci retracements to go along with some key price action swings.
On the support side of the matter – there’s an item of interest around the 1700 psychological level, which syncs with a prior price action swing, after which the Fibonacci level at 1689.68 comes into view. Below that – we’re looking at a zone from the June low up to last week’s low as an ‘s3’ support zone.
GOLD HOURLY PRICE CHART
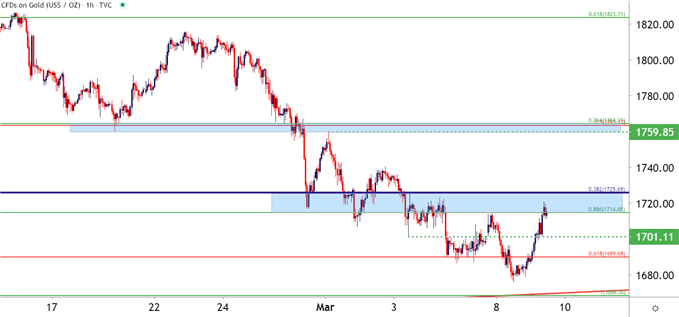
Chart prepared by James Stanley; Gold on Tradingview
Disclosure: See the full disclosure for DailyFX here.


