
Gold Price Forecast: Gold Goes Reversal, 1800 Snap Back On FOMC
It’s been another discouraging week for Gold bulls, with the drama heightening on Tuesday afternoon, about 24 hours ahead of the FOMC rate decision. The yellow metal perked up to a fresh two-month high while testing above a resistance level at 1850. That level was also confluent with a bearish trendline, and the fact that this was showing a day ahead of one of the most important rate decisions of the past couple years seemed suspect. As I shared in the webinar at the time, that setup looked prime for a fade or reversal, and that’s what’s shown so far, with another push of motivation yesterday around the FOMC.

Photo by Jingming Pan on Unsplash
At this point, Gold prices are back to testing the familiar psychological level at 1800. There’s been a trendline break that gives it an even more bearish appearance and four-hour RSI has already quickly moved into oversold territory after teasing overbought conditions just a week ago.
Gold Four-Hour Price Chart
(Click on image to enlarge)
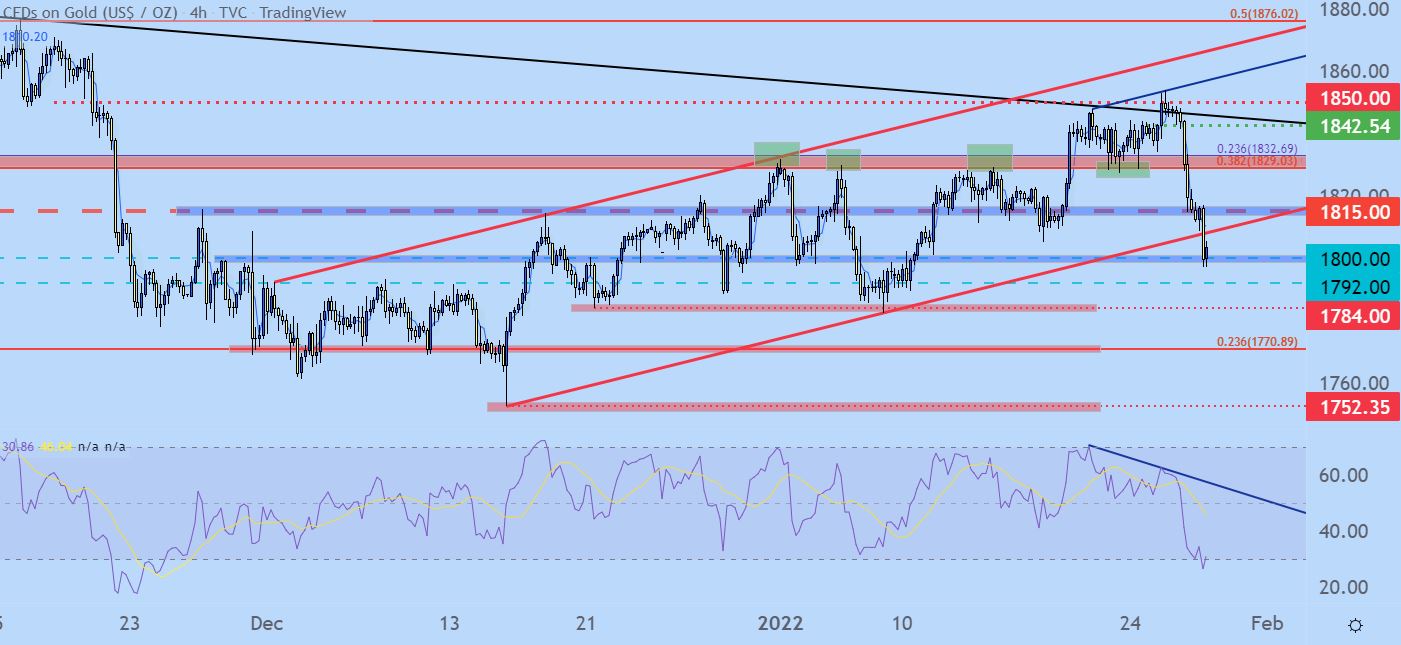
Chart prepared by James Stanley; Gold on Tradingview
Gold Bigger Picture
The longer-term chart in Gold remains bearish with a descending triangle formation. The bearish trendline from that setup is what was tested earlier this week.
This longer-term chart also highlights the importance of the 1770 level, which has helped to hold support since early-November, with 1752 coming in as the current three-month-low. Whether these levels can be tested soon will be determined by just how aggressive this rush of USD-strength remains to be in the backdrop of the FOMC rate decision that just rolled out yesterday.
Gold Weekly Price Chart: Descending Triangle Remains
(Click on image to enlarge)
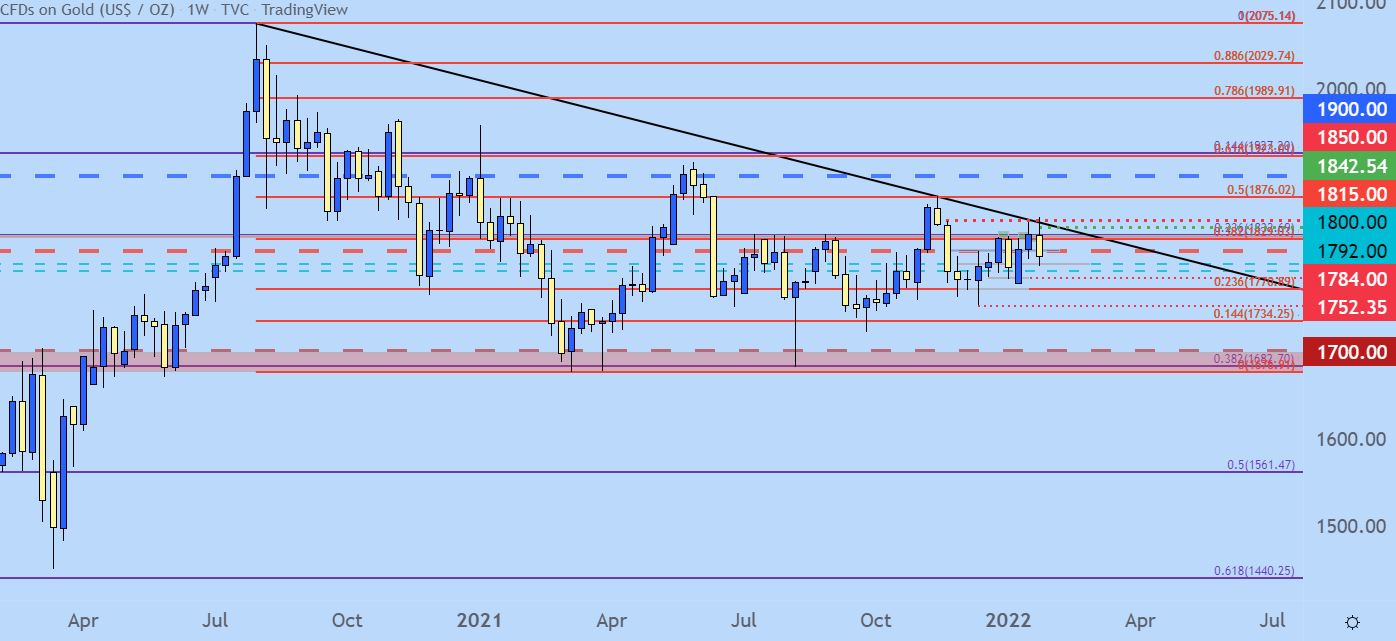
Chart prepared by James Stanley; Gold on Tradingview
Gold Near-Term Levels
At this point many of the same levels remain in-play on Gold. Prices is right now bouncing from the 1800 psychological level and the next spot of resistance is the 1815 level that’s been in-play for a month now. That can be looked at as an ‘r1’ with ‘r2’ resistance at the confluent 1830 spot that’s given bulls so much heartburn of late. And then 1850 can suffice as the ‘r3.’
On the support side of the matter 1800 is fairly clear, below that is a possible stop around the 1792 price although that looks less consistent than the 1784 spot that’s currently marking the 2022 low: I’d default to that as my ‘s2.’ And for the ‘s3’ spot I’m looking at that price around 1770.
For now, given how Gold prices are bouncing from oversold conditions, looking for that lower-high resistance appears to be the attractive manner of moving forward.
Gold Four-Hour Price Chart
(Click on image to enlarge)
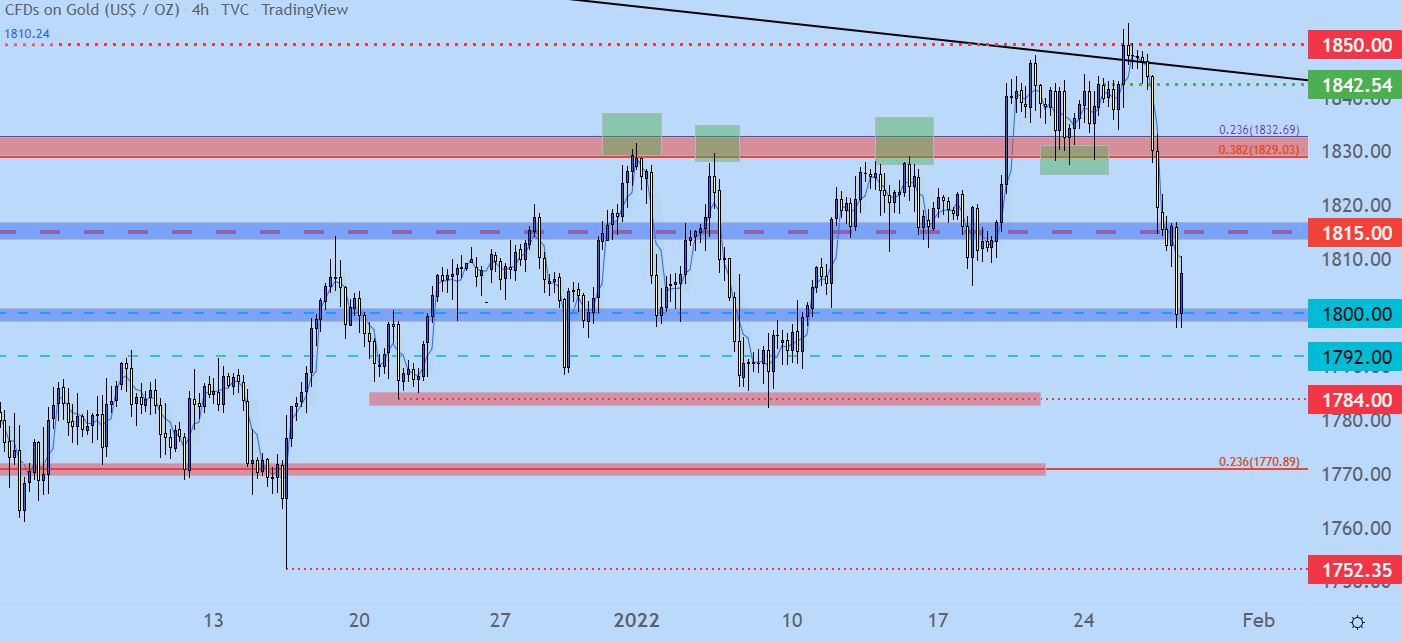
Chart prepared by James Stanley; Gold on Tradingview
Disclaimer: See the full disclosure for DailyFX here.


