
Gold Price Forecast: Gold Bulls On The Bid, XAU Rallies To Resistance
Gold bulls may finally be getting back in the driver’s seat after what’s now been four months of digestion. In early-August, bulls were large-and-in-charge as Gold prices went deeper into overbought territory. Even the $2,000 level couldn’t stop the rally as buyers just broke through the psychological level with a minimum of resistance. Gold finally set that all-time-high at the $2,075 level, before a bearish engulfing pattern showed up on the same day that the high was set.
After the weekend and over the next few trading days Gold bulls were trampled over; sellers pushed prices lower by more than $200 before a key zone of confluent support showed up. This zone runs from 1859.25-1873.01, and over the next three months caught numerous support inflections. That support held all the way into November 23rd, at which point sellers finally pushed for a breakdown. And that lasted into the final trading day of November when deeper support showed up around the 76.4% retracement of the June-August major move.
GOLD PRICE DAILY CHART
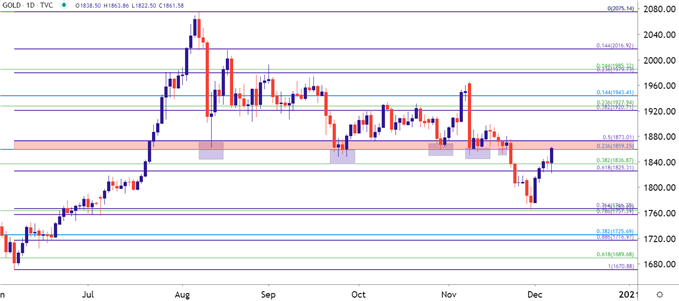
Chart prepared by James Stanley; Gold on Tradingview
GOLD STRATEGY: WAS THAT THE WASHOUT?
The cyclical nature of markets can be a rude item for short-term traders. When a trend gets as overbought as Gold did this summer, there could be a simple case of technical criteria overtaking the fundamentals in a situation until, eventually, matters reset a bit.
Gold prices remained very strong through the August open as USD-weakness was continuing to run. The USD finally found a bit of support in September, and then showed a three-plus week pattern or strength. During that time, Gold prices simply grinded down for another support test at the same zone that’s currently helping to set resistance.
It was the Covid vaccine news in November that really seemed to spur capitulation. The initial announcement from Pfizer on November 9th led to an aggressive bearish push right back down to this key zone of support. The Moderna news a week later led to more of the same; but it was the following Monday, on November 23rd, the same day of the AstraZeneca vaccine report that Gold prices really started to sell-off with aggression.
The rest of that week was pretty bearish as Gold prices sunk down to that 76.4% Fibonacci retracement. Curiously, the US Dollar wasn’t exactly strong during this stretch, and we were witness to one of those rare scenarios in which Gold and USD were positively correlated.
Last week saw Gold strength come back as USD-weakness showed up with aggression, begging the question as to whether we’ve seen capitulation during the ‘washout’ breakdown from two weeks ago, which could be re-opening the door for longer-term bullish strategies in the yellow metal. The below chart adds a correlation table at bottom to see the re-emergence of the inverse correlation between Gold and the US Dollar.
GOLD EIGHT HOUR PRICE CHART
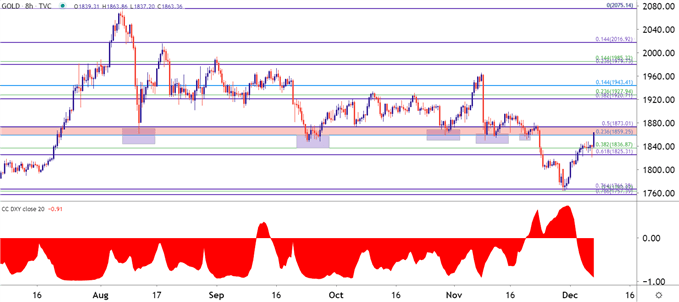
Chart prepared by James Stanley; Gold on Tradingview
GOLD PRICES NEAR-TERM: BULLS HAVE TO PUSH
Ironically, the challenge near-term is just how quickly this bullish move has priced-in for Gold; and if today shows a close at resistance, the door could remain open for short-term bearish swing strategies.
But, that said, from shorter-term charts there has been healthy construction of this recent bullish move. We can’t quite rule this out from being a ‘bear market bounce,’ but, given the continuation of higher-highs and higher-lows, combined with the longer-term bullish cycle that still appears remain in order, there can be a building excitement for a possible return of bullish price action into Gold prices.
GOLD WEEKLY PRICE CHART
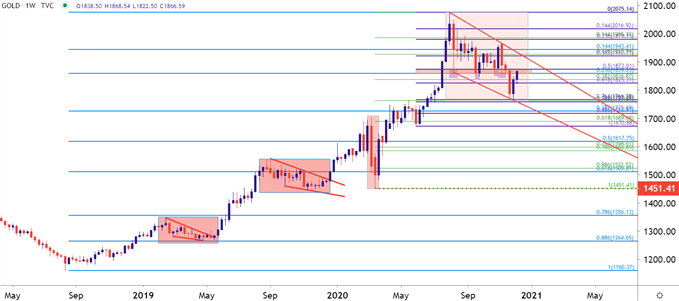
Chart prepared by James Stanley; Gold on Tradingview
Disclosure: See the full disclosure for DailyFX here.


