
Gold Price Forecast: Gold After The Bear Flag Breach, CPI On Deck
Gold prices are holding support at a key Fibonacci level to start this week, and there’s a trove of drivers on the economic calendar that can produce some outsized moves.
But for bears, there was an open window to drive to fresh lows last week, but Friday price action showed a bullish engulfing pattern. This may be showing a bit of exhaustion from sellers after an aggressive two-week trend pushed prices lower. Also of consideration, Treasury Yields remain relatively weak, all factors considered, and a continued fall there could further buoy gold prices ahead of the Friday release of CPI out of the United States.
That CPI data, however, may be an important driver. Last month saw Gold prices spike when CPI printed well-above expectations. And given the recent move in rates, a strong inflation print could further weaken real rates, which generally has a positive push to gold prices.
GOLD BEAR FLAG
Gold prices breached below bear flag support last week, running into a Fibonacci level at 1770 that’s since helped to slow the decline. That led into the bullish engulf from Friday, and prices appear headed back to a key spot on the chart that’s seen some significant grind, from around 1792 up to the 1800 psychological area. The peak of that zone appears to be around 1815, which was the high from Black Friday when the Omicron variant was getting priced-in.
For sellers, looking for some element of rejection around that 1800 spot could keep the door open for bearish continuation scenarios.
For bulls, it’s a difficult case to make for longer-term strength until the 1834 level is traded through again. That’s not to say that there’s no potential for longs, as there could remain breakout logic at or around that 1815 level that did a great job of holding the highs on Black Friday.
For bearish targets – the next major area lower on the chart appears to be around the 1730 area, where prices pivoted in August and again in late-September.
GOLD DAILY PRICE CHART
(Click on image to enlarge)
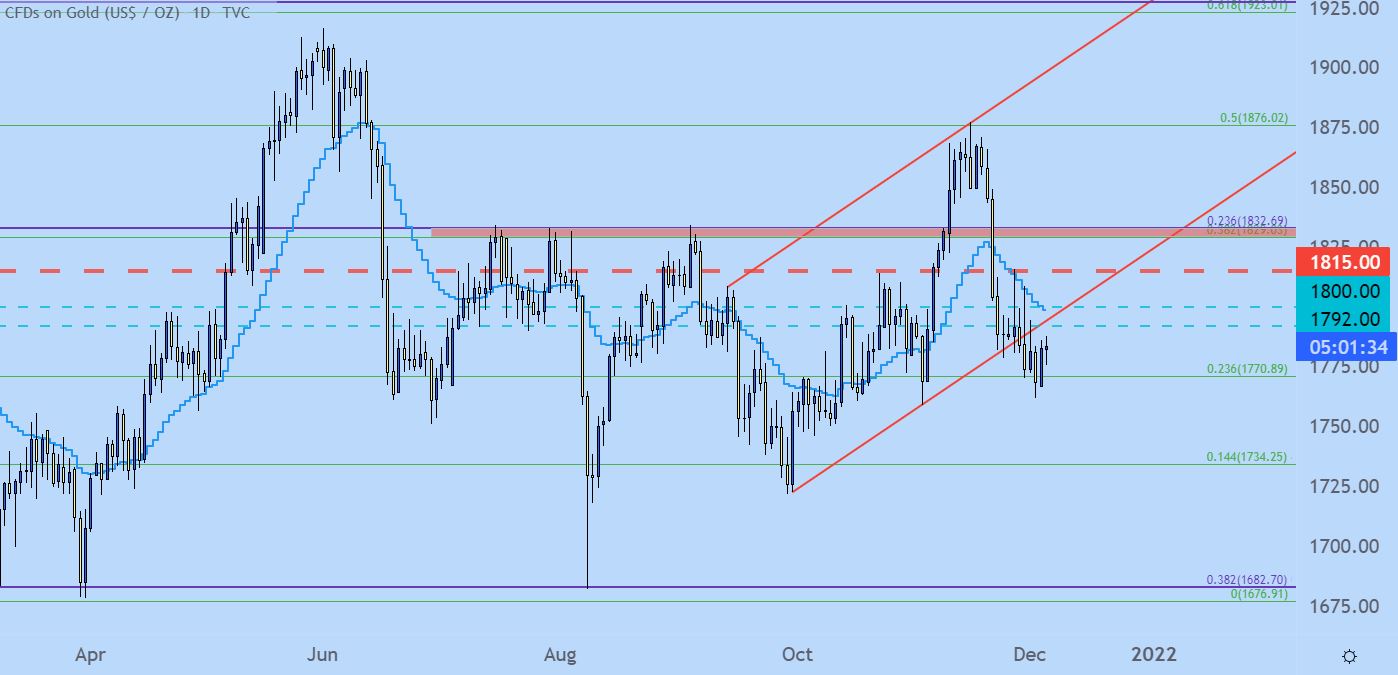
Chart prepared by James Stanley; Gold on Tradingview
Disclaimer: See the full disclosure for DailyFX here.


