
Gold Price Forecast Bright & Volatile As USD, Real Yields Swing
Gold performance continues to glisten. The precious metal has staged an impressive 12% rally over the last three weeks, which just catapulted XAU/USD to an all-time high above the $2,000-price level. This recent extension higher lifts gold price action to a 33% gain year-to-date. What fundamental forces are fueling the gold breakout and is there potential for bullion to advance further?
GOLD PRICE EXPLODING HIGHER AS REAL YIELDS CRASH (CHART 1)
(Click on image to enlarge)
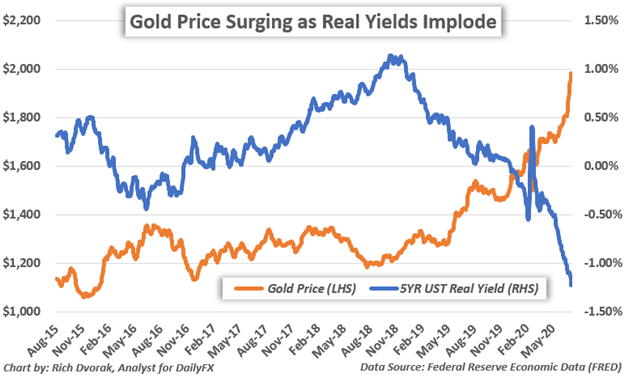
The price of gold holds a strong inverse relationship with real yields, generally speaking, and underscores a primary driver of the yellow-metal’s broader direction. To that end, real yields have been crashing lower since August 2018, which just so happens to correspond with where gold prices bottomed two years ago.
In light of this typically negative correlation maintained by gold and real yields, it comes as little surprise that XAU/USD price action is ballooning to record highs while real yields sink to record lows. The latest stretch lower in real yields widely follows unparalleled Fed asset purchases in conjunction with slashing benchmark interest rates to zero, and judging by recent commentary from Fed Chair Jerome Powell, the central bank looks set on maintaining its accommodative monetary policy stance for the foreseeable future.
An uber-dovish Federal Reserve not only stands out as the primary catalyst helping propel precious metals higher recently, but with the FOMC drowning the market in liquidity and other easy-money measures aimed at loosening financial conditions, plus staggering fiscal stimulus outlays leading to historic deficit spending by the US Treasury, there has been a resurgence of the anti-fiat narrative. That said, on the back of a nasty acceleration in US Dollar weakness last month, it appears this theme of currency devaluation is gaining traction, and likely contributes to bullish gold price action.
GOLD & SILVER PRICES GOING PARABOLIC AMID SHARP US DOLLAR WEAKENING (CHART 2)
(Click on image to enlarge)
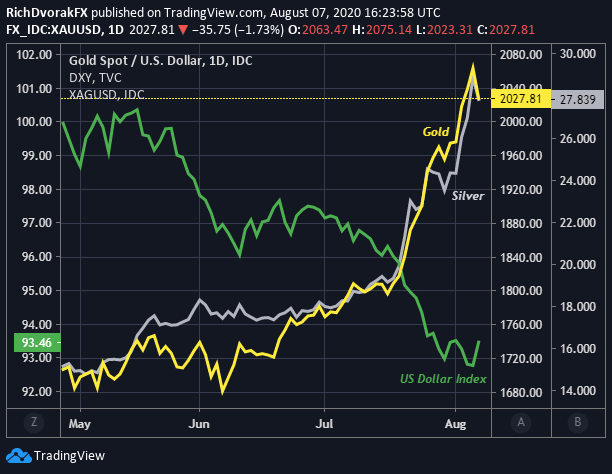
Chart created by @RichDvorakFX with TradingView
Considering these aforementioned fundamental drivers have weighed positively on precious metals recently, and keeping in mind that the trend is your friend, there may be potential for gold and silver prices to continue climbing in the days ahead. If real yields recoil and the US Dollar rebounds, however, gold and silver might stumble lower in response as this could correspond with a deterioration of the standing bull thesis.
An influx of widespread risk aversion – perhaps earmarked by a steep reversal lower in major stock market indices – may spark XAU/USD selling pressure as investors ‘dash for cash’ and liquidate positions like they did during the March selloff. Nevertheless, threats from possible headwinds hanging over gold and silver could prove short-lived. This is owing to the notable probability that more government and central bank intervention would likely follow the next material downturn in economic activity, which might keep anti-fiat assets such as gold, silver, and even bitcoin broadly in demand across longer time frames.


