
Gold Price Consolidation Sets Stage For Rally To Fresh 2019 Highs
It’s been nearly a week since the last substantive gold price technical analysis update, and for good reason: not much has changed. Since the week of the June Fed meeting, gold prices have traded in a 4% range since the market close on June 21; and since June 21, gold prices are up by a slight 0.8%. Despite rebounds in higher beta assets and higher yielding currencies alike, gold prices have maintained their elevation. Stability in the face of adversity – an improved environment for risk appetite – bodes well for gold’s future prospects.
FED RATE CUT EXPECTATIONS FIRM UP
Both Fed funds futures and Eurodollar contracts are suggesting that the Federal Reserve will begin an aggressive interest rate cut cycle at the July 30 to 31 FOMC meeting, developments that have undergirded the most significant factor in the gold price rally since the end of May. With Fed funds pricing in greater than a 50% chance of 75-bps of rate cuts in 2019 and Eurodollar contract spreads (June 2019/December 2019) discounting -70-bps through the end of the year, expectations remain firm for more accommodative policy action. To this end, with short-term US Treasury yields biased lower over the past several months, the ongoing erosion in US real yields continues to serve as a fundamentally bullish backdrop for gold prices.
GOLD VOLATILITY REBOUND ESTABLISHING A BASE FOR GOLD PRICES?
If volatility is the market's manifestation of uncertainty, gold volatility’s expansions and contractions since the end of May can be traced back through the uncertainty created by the US-China trade war and the ensuing speculation around the Fed rate cut cycle. While other asset classes don’t like increased volatility (signaling greater uncertainty around cash flows, dividends, coupon payments, etc.), precious metals tend to benefit from periods of higher volatility as uncertainty increases the appeal of gold’s and silver’s safe haven appeal.
GVZ (GOLD VOLATILITY) TECHNICAL ANALYSIS: DAILY PRICE CHART (OCTOBER 2016 TO JULY 2019) (CHART 1)
(Click on image to enlarge)
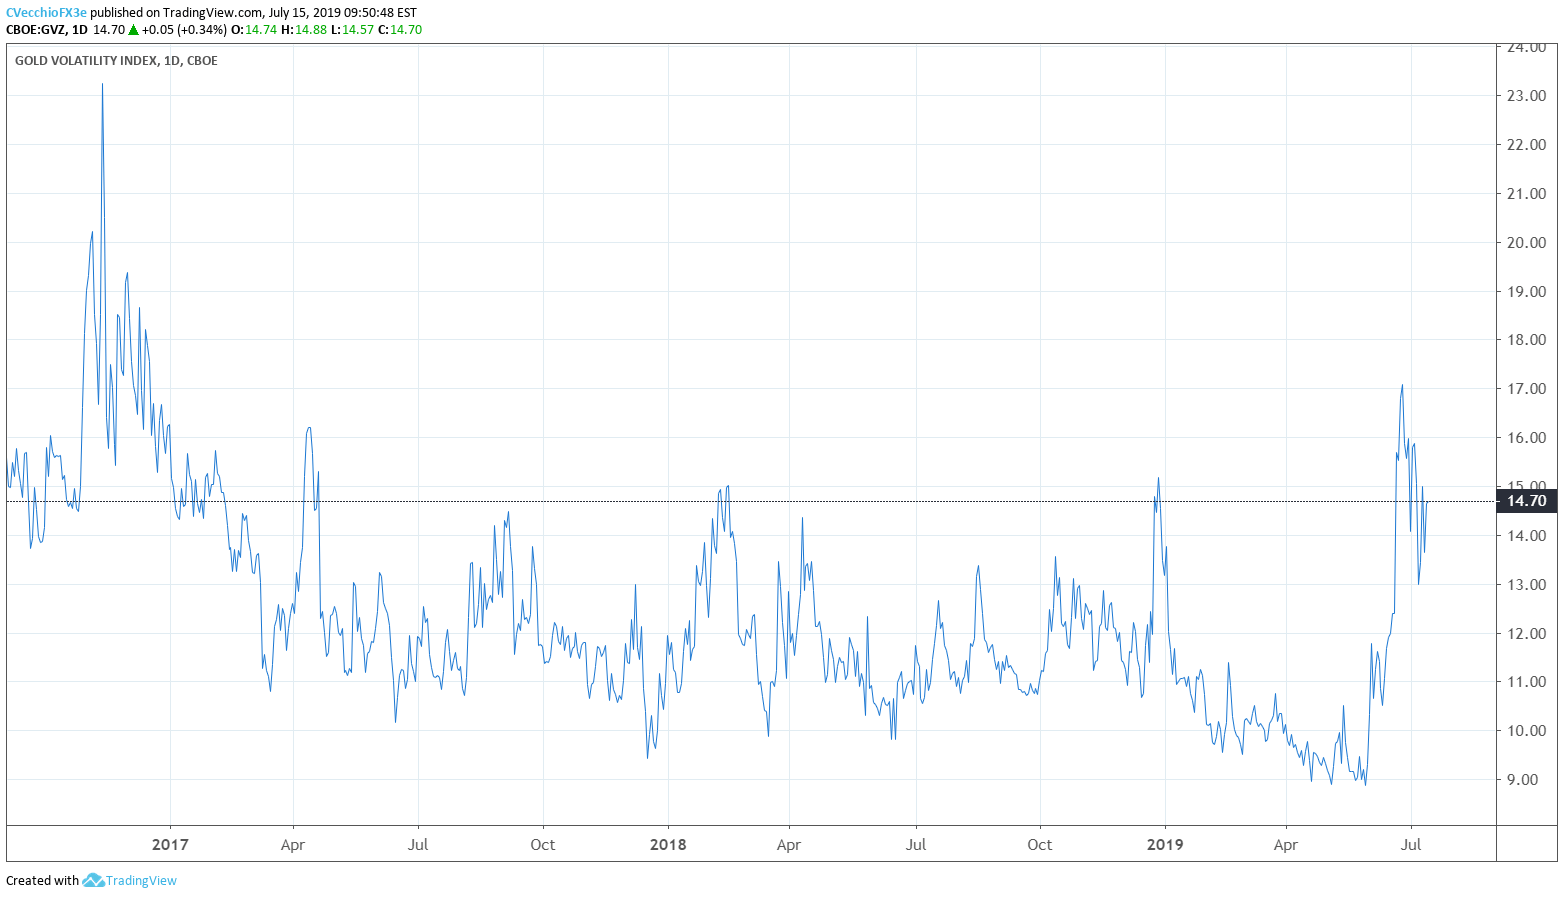
Gold volatility (as measured by the Cboe’s gold volatility ETF, GVZ, which tracks the 1-month implied volatility of gold as derived from the GLD option chain) remains off of its yearly high set at the end of June at 17.08, but has rebounded off of the July low at 13.00 to 14.70. Because gold volatility has failed to contract more during a time of significant strength in equity markets, it stands to reason that a base is forming for higher gold prices. The recent observation that “gold prices are proving resilient during the recent correction, a sign that recent price action has been corrective rather than the end of the longer-term bottoming effort and inverse head and shoulders” is still valid.
GOLD PRICE TECHNICAL ANALYSIS: DAILY CHART (JULY 2018 TO JULY 2019) (CHART 2)
(Click on image to enlarge)
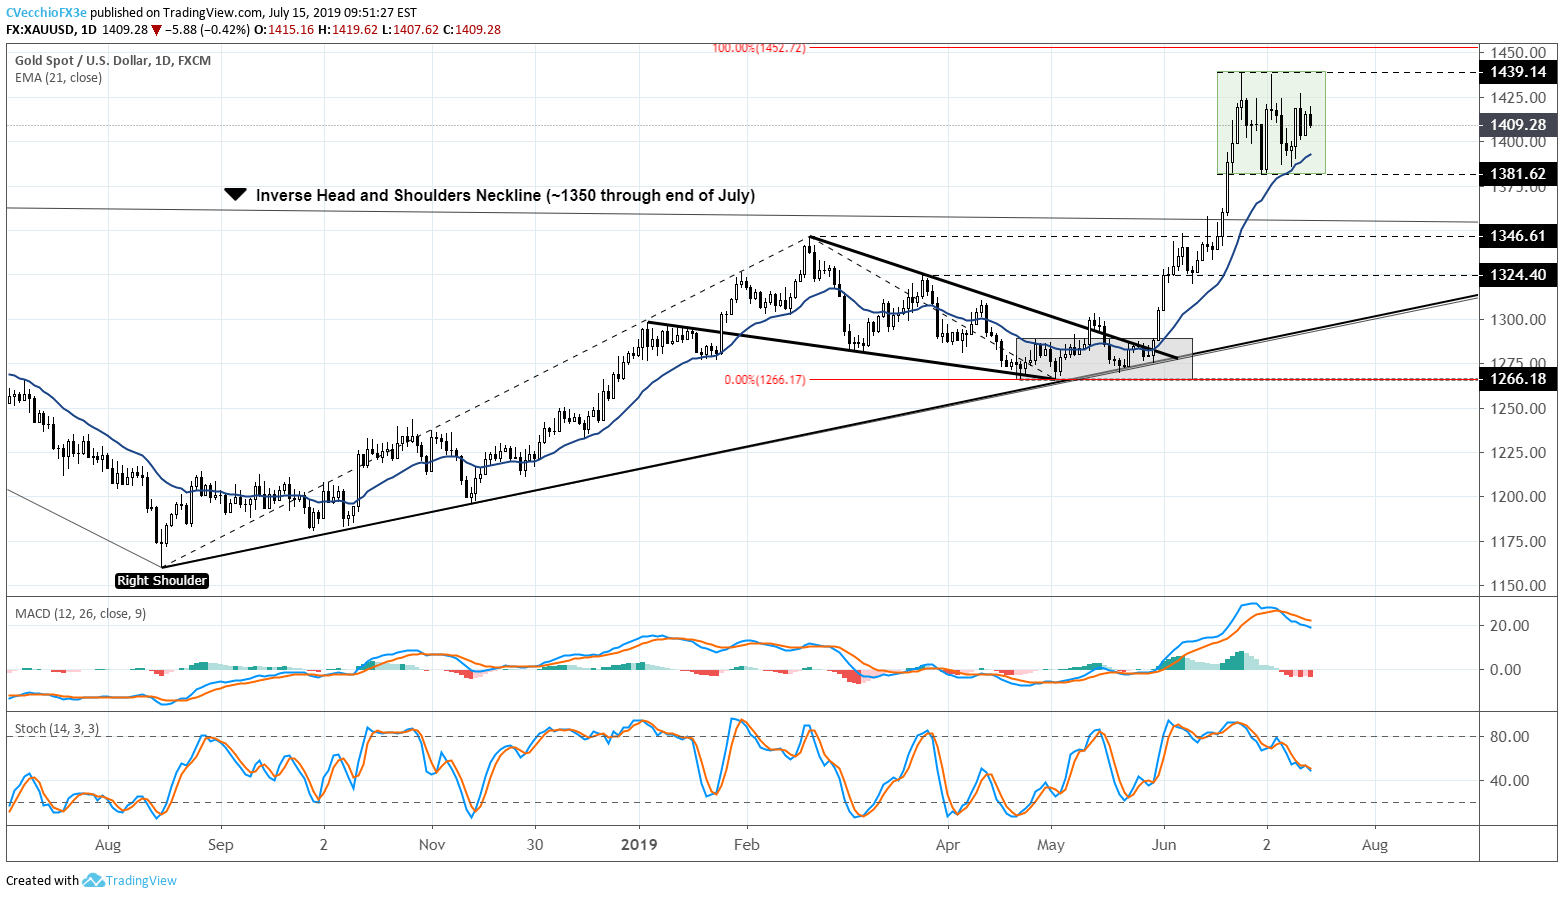
The ongoing sideways consolidation in gold prices is setting the stage to fresh 2019 highs. But not much has changed, technically speaking, since our last gold price technical analysis update. Thus, “while the long-term forecast for gold prices remains bullish as long as the inverted head and shoulders pattern neckline is intact, traders may still want to be patient here as the odds of more weakness if not sideways price action have increased…A consolidation after an uptrend is typically the sign of a continuation effort; the sideways consolidation has a bullish bias.”
A break above 1439.14 would signal the start of the bullish continuation in the multi-month gold price rally. Furthermore, it is still valid that “unless gold prices lose 1381.62 as well as the daily 21-EMA, a moving average that hasn’t been closed below since the bullish outside engulfing bar/key reversal on May 30, then there is still good reason to believe that the long-term bullish forecast remains valid. Even so, the inverse head and shoulders pattern neckline doesn’t come back into play until 1350 at the end of July.”
IG CLIENT SENTIMENT INDEX: SPOT GOLD PRICE FORECAST (JULY 15, 2019) (CHART 3)
(Click on image to enlarge)
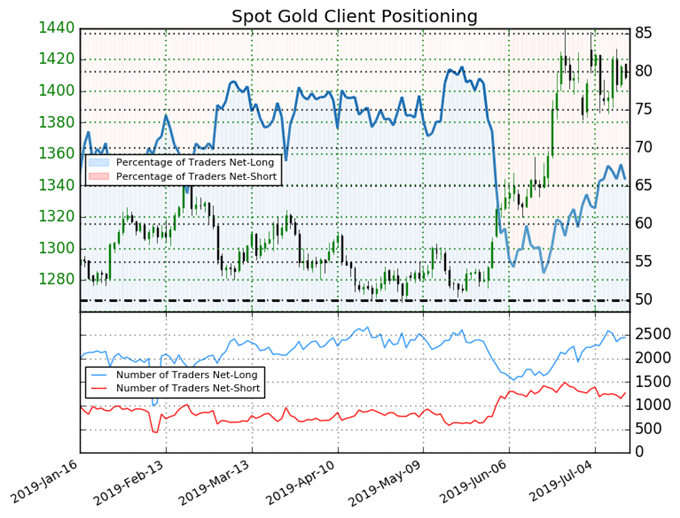
Spot gold: Retail trader data shows 65.8% of traders are net-long with the ratio of traders long to short at 1.93 to 1. The number of traders net-long is 2.4% lower than yesterday and 2.5% lower from last week, while the number of traders net-short is 2.0% higher than yesterday and 1.2% higher from last week.
We typically take a contrarian view to crowd sentiment, and the fact traders are net-long suggests spot gold prices may continue to fall. Yet traders are less net-long than yesterday and compared with last week. Recent changes in sentiment warn that the current spot gold price trend may soon reverse higher despite the fact traders remain net-long.


